
How ‘charting’ can help you decide when to buy or sell in volatile markets
- Fri 01 May 2020
It is a good time to understand the basics of technical analysis.
Technical analysis has been used by traders and analysts for centuries but became increasingly popular recently as it achieved broad acceptance among the academic community and in part thanks to advancements in charting packages and trading platforms.
Technical analysis is a form of securities analysis that uses price and volume market data, usually displayed graphically. It is the study of market trends or patterns and relies on recognition of patterns that have worked in the past in an attempt to predict future prices.
(Editor’s note: The free online ASX Charting Library is a good place to start if you are interested in learning about charting terms and different chart patterns).
Technical analysts believe market trends and patterns repeat themselves because human behaviour tends to repeat itself and is somewhat predictable.
The concept of trend is perhaps the most important aspect of technical analysis. An uptrend is defined as higher highs and higher lows, and to draw an uptrend line a technician connects the lows of the price chart.
Chart 1: A price trend channel
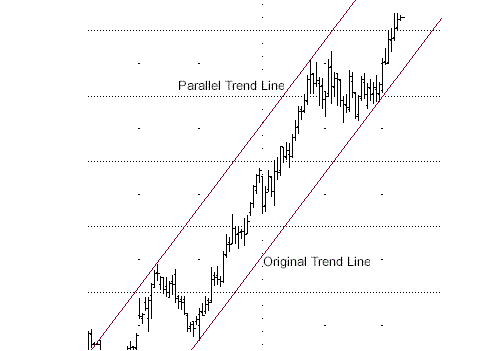
Source: ASX
A downtrend is defined as a security making lower highs and lower lows, and to draw a downtrend line a technician connects the highs of the price chart.
Chart 2: A price downtrend
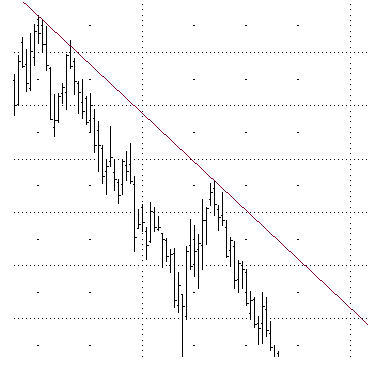
Source: ASX
A sideways market is when the price fluctuates between support and resistance.
Support is defined as a price range in which the price stops declining because of buying activity. It is the opposite of resistance, which is a price range in which the price stops rising because of selling activity.
Past and future behaviour
Charts provide information about past price behaviour and give a basis for inferences about likely future behaviour.
Various types of charts can be useful in studying markets: line charts, bar charts, candlestick charts, and point and figure charts. Patterns are formations appearing in charts that create some type of recognisable shape.
Reversal patterns signal the end of a trend. Common patterns are the head and shoulders, the inverse head and shoulders, double tops and bottoms, and triple tops and bottoms.
Chart 3: A head and shoulders pattern
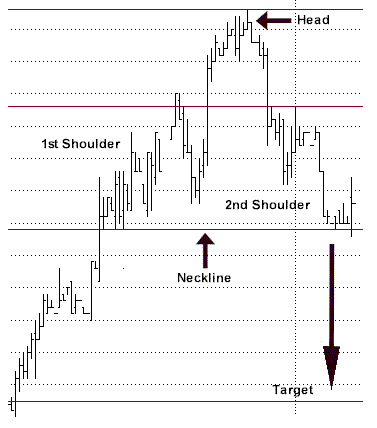
Source: ASX
Chart 4: A double tops and bottoms pattern
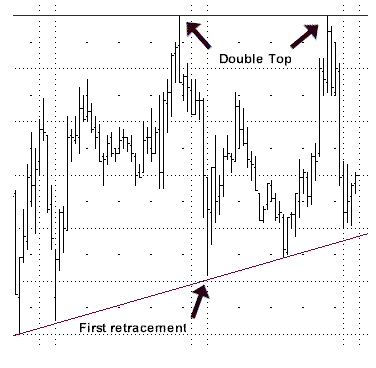
Source: ASX
Continuation patterns indicate that a market trend in place before the formation will continue once the pattern is completed. Common patterns are triangles, rectangles, flags and pennants. Analysis can be used in all timeframes. For example, a triangle may form in a matter of days or a head and shoulders top may take months.
Patterns provide a framework to analyse the forces of supply and demand. They give a clear and concise picture and allow an investor to determine who is more dominant (buyers or sellers) so that they can position themselves appropriately.
Markets can unfold simultaneously in more than one timeframe and according to Dow Theory they have three clearly defined movements, which fit into each other.
The first is the short-term timeframe capturing daily fluctuations. The secondary movement covers a period ranging from 10 days to 60 days, averaging probably between 30 and 45 days. The third move is the primary trend covering from four to six years (Nelson, 1903).
Be wary of timeframes
When the market is trending, traders aim to take a position in the direction of the trend only and never trade against it. Also, traders should take signals only from the timeframe they are trading. A financial instrument can trade downwards in the short term, sideways in the medium term and upwards in the long term.
Therefore, closing a long-term position based on a short-term signal would be premature. In a trading range, traders aim to open long positions near the support and take profits and/or go short near the resistance.
Determining the trend and identifying the chart patterns could sometimes be subjective. To remove this, technical analysts use a range of mathematical indicators, which are derivatives of the price. Since the indicator crossing a centre line or reaching certain levels generates most of the trading signals, some of this subjectivity is removed.
Most technical indicators fall into one of two categories: trend following or momentum. Trend-following indicators seek to define trends objectively and are designed to smooth price data so a trend can be represented as a line. Their purpose is to detect the beginning and ending of trends. Examples include moving averages, the average directional index (ADX), and on-balance volume (OBV).
Momentum indicators seek to measure the speed at which prices are changing. They are designed to detect the swings of prices within a trading range or trend. Their purpose is to time trades as prices swing between under and over valuation. Examples include Bollinger Bands, the Commodity Channel Index (CCI), the Relative Strength Index (RSI), and stochastic.
Some indicators, like the moving average convergence divergence (MACD), can be used to generate either a trend-following or momentum trade signal.
When selecting indicators it is a good idea to choose one momentum indicator that is considered to be a leading indicator, such as the RSI, and one that is a lagging indicator, such as the moving averages.
Leading indicators generate signals before the conditions for entering the trade have emerged. Lagging indicators generate signals after those conditions have appeared, so they can act as confirmation of leading indicators and prevent you from trading on false signals.
Using charting indicators
Whichever indicators are incorporated into the trading system, take notes on their effectiveness over time.
Ask yourself: What are an indicator's drawbacks? Does it produce many false signals? Does it fail to signal, resulting in missed opportunities? Does it signal too early (more likely of a leading indicator) or too late (more likely of a lagging one)?
We may find one indicator is effective when trading stocks but not as effective when trading foreign exchange, for example. We might want to swap out an indicator for another one of its type, or make changes in how it is calculated. Making such refinements is a key part of success.
About the author