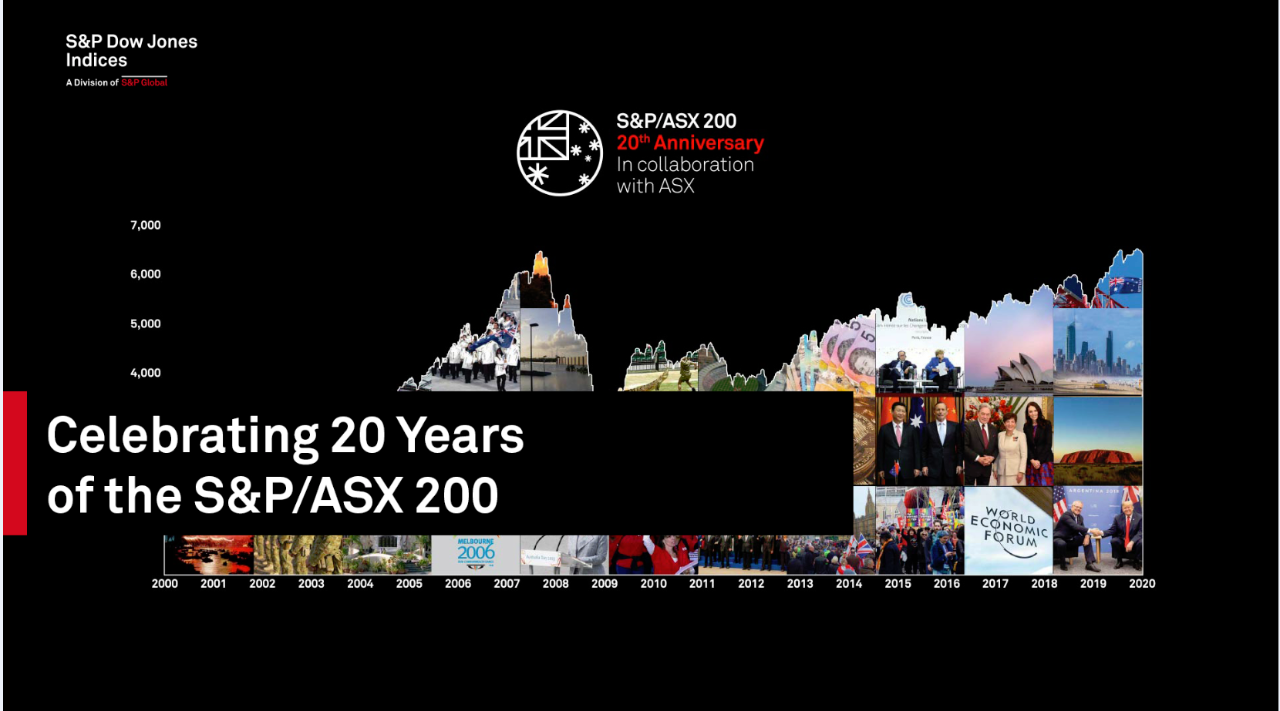
S&P/ASX 200 Index has its 20th anniversary
- Fri 03 April 2020
For two decades the S&P/ASX 200 Index – one of the world’s pre-eminent sharemarket indices – has measured the performance of Australia’s 200 largest and most-liquid eligible ASX-listed stocks, providing reliable, relevant and real-time investment information.
The S&P/ASX 200 had its 20th anniversary on 3 April 2020 at the end of what was a remarkable month for Australian and global shares amid the coronavirus crisis.
The Index has long been the barometer of sharemarket reaction to defining moments in our nation’s history, recording bull and bear markets and much more in between.
These events have included the crash in technology shares in 2000, the 2008-09 global financial crisis and the unfolding COVID-19 pandemic this year.
In some ways, the S&P/ASX 200 provides a modern history of corporate Australia. Index constituents have changed over time as companies have merged or been taken over, changed their name, had a falling or rising share price (and gone in or out of the Index) or failed.
Over Forty companies in the Index in March 2000 remain there today. They include great Australian companies such as BHP Group, Telstra Corporation, the four big banks, Woolworths, Qantas Airways, CSL, Cochlear and Transurban Group.
Sector composition has also changed. As a much larger technology sector has developed on ASX, so too has technology’s weighting in the S&P/ASX 200. The same is true of healthcare, underpinned by growth in CSL, Cochlear and other companies in that sector.
On 3 April 2000, the S&P/ASX 200 had a starting value of 3,331 points. The index hit an all-time high of 7,199 points in February 2020, just before the COVID-19 crisis escalated.
Millions of Australian investors and many more overseas rely on the S&P/ASX 200 daily, so it pays to learn more about it. This article summarises:
- How the S&P/ASX 200 Index works.
- How different investors use it.
- What the S&P/ASX 200’s performance tells us about long-term investing.
1. How the index works
The S&P/ASX 200 Index (ASX Code: XJO) is delivered through an enduring partnership between the Australian Securities Exchange and S&P Dow Jones Indices that has driven index innovation and excellence. S&P Dow Jones Indices operates the S&P/ASX 200.
The S&P/ASX 200 is the best known of a range of real-time S&P/ASX indices by market capitalisation, sectors, asset classes, strategies or volatility.
Most investors are probably familiar with the S&P/ASX 200 through daily media reports. Finance bulletins typically refer to the S&P/ASX 200 Index and/or the All Ordinaries Index.
There are important differences between the two. The S&P/ASX 200 consists of the 200 largest (by market capitalisation) and most liquid ASX-listed companies; is rebalanced quarterly, and has relative market capitalisation, liquidity and free-float requirements.
In contrast, the All Ordinaries Index (ASX Code: XAO) consists of the 500 largest (by market-capitalisation) ASX-listed companies, is rebalanced annually and has no liquidity or free-float requirements. The S&P/ASX 200 is widely considered to be Australia’s leading sharemarket index and is an industry benchmark to measure performance of stock portfolios.
Many investors follow the S&P/ASX 200 Accumulation Index. Accumulation indices assume dividends are reinvested, thus measuring the combined capital growth and dividend return (the total shareholder return). The Australian sharemarket has a higher average dividend than many comparable overseas markets, so it pays to consider accumulation indices.
According to S&P Dow Jones Indices data, the S&P/ASX 200 Index at 28 February 2020, had:
- Companies with an average mean market capitalisation of $9.1 billion.
- The largest company (Commonwealth Bank) had a market capitalisation of $143.9 billion; the smallest was capitalised at $500 million.
- The top 10 companies accounted for 45 per cent of the index.
- The top five companies by market capitalisation were Commonwealth Bank, CSL, BHP Group, Westpac Banking Group and National Australia Bank.
- By sector, financials accounted for 30 per cent of the index, followed by materials (17 per cent), healthcare (12 per cent), industrials (8 per cent) and real estate (8 per cent).
- Of the 200 index constituents, 187 were headquartered in Australia.
- The Index also aggregates several carbon characteristics of its constituents, providing important Environmental, Social and Governance (ESG) data.
2. How investors use the index
The S&P/ASX 200 Index has many uses. For many retail investors, the index is a snapshot of sharemarket health; they follow the index to know if the market had a good or bad day.
Other retail investors use the S&P/ASX 200 Index to track the market’s performance against that of their portfolio, or as a tool to help rebalance their portfolio, perhaps annually.
Institutional investors rely on the S&P/ASX 200 as an investable benchmark. A fund manager that invests in large-cap Australian stocks might measure their fund’s performance against the S&P/ASX 200 Accumulation Index and will aim to outperform the Index return.
Fund managers often use the S&P/ASX 200 index to guide their sector and stock allocations. When a broking firm has an “overweight” recommendation on a stock, it is suggesting fund-manager clients hold a higher allocation of the company compared to its Index weighting.
When a fund manager says they are “underweight” a sector, such as banking, it means they have less of that sector in their portfolio compared to its weighting in their fund’s benchmark underlying index.
Institutional investors might form a view on whether Australian shares are overvalued or undervalued by using aggregate data in the S&P/ASX 200 Index. Using broking estimates, some managers compare the average forward price-earnings (PE) multiple of the S&P/ASX 200 Index to its long-term average, to gauge the market’s current value.
Product issuers also use the Index. Some ASX-quoted exchange-traded funds (ETFs) aim to replicate the price and yield performance of S&P/ASX 200. For example:
- State Street Global Advisors’ SPDR S&P/ASX 200 Fund (STW),
- iShares Core S&P/ASX 200 ETF (IOZ).
Investors seeking low-cost, diversified exposure to the market’s 200 largest companies, as measured by the S&P/ASX 200, might consider ASX-quoted ETFs over this Index.
3. What the Index’s performance tells us about long-term investing
The S&P/ASX 200 Index reinforces the power of long-term investing. At times like these, when uncertainty around COVID-19 is high and fear can spark rash investment decisions, a chart of the S&P/ASX 200 over its history highlights the market’s propensity to recover from crises.
S&P Dow Jones Indices
The above chart shows the S&P/ASX 200 Index’s performance from 2000 to the start of 2020, (meaning it does not include large falls in the index in late February and March this year).
History is only a guide and investors should also do their own research or talk to a licensed financial adviser before making decisions based on the likely direction of Australian shares, as based on the S&P/ASX 200 index.
Nevertheless, the long-term chart of the S&P/ASX 200 Accumulation Index (including dividends) may provide some context for current market turmoil:
- On a price and dividends reinvested basis, the S&P/ASX 200 Accumulation Index had four years of negative total returns over 20 years (to the start of 2020).
- The largest fall in that time was during the 2008 GFC, when the S&P/ASX 200 Accumulation Index returned minus 38.4 per cent that year. The next largest negative return was 10.5 per cent in 2011 when Corporate Australia was still in recovery, and an 8.7 per cent negative return in 2002 after the global crash in tech shares.
- Conversely, the S&P/ASX 200 Index delivered a positive return in 16 of 20 years to the start of 2020. The largest return was 37 per cent in 2009 as the market recovered from the GFC, followed by 23.4 per cent in 2019 and 20.2 per cent in 2012.
The S&P/ASX 200 Index has historically delivered its best annual returns in the first few years of a market crisis. Investors will hope history is repeated when the coronavirus pandemic is contained and the global economy stabilises.
About the author