
Five all-time highs in 2024 for S&P/ASX 200 index
- Tue 02 April 2024
- 3 MIN READ

With a full quarter of 2024 behind us, the S&P/ASX 200 is up slightly for the year. Despite low single digit year to date performance, the index has achieved five all-time highs this year. Stocks keep grinding higher, but at the same time geopolitical risk is also rising. Even with a moderately bullish stock market, it may make sense to implement some protection against a quick drop in equity prices. In this article, we used market data from the past couple of weeks to price a few hedges that may be appropriate for peace of mind.
The daily chart below shows this performance along with highlighting the five record high closes.
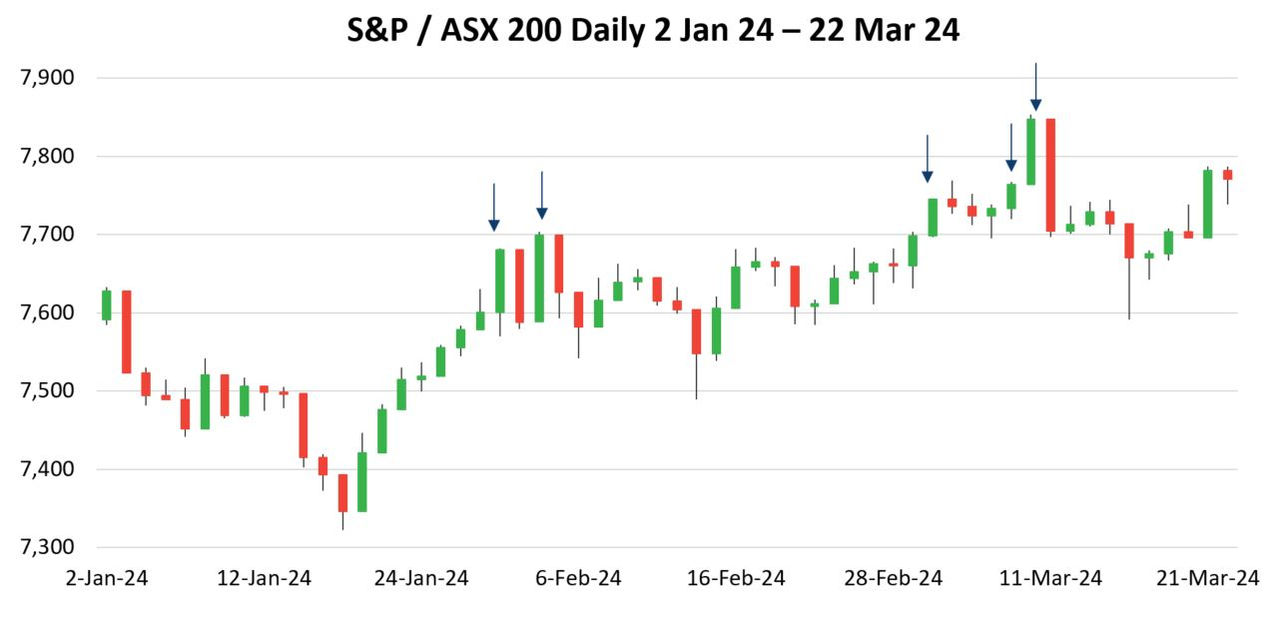
Data source: Bloomberg
Collar strategy
A common low-cost method of hedging is a collar, where a call is sold and put is purchased. The idea here is for the premium from the call sale to cover at least a portion of the put cost. The last recent high for the S&P/ASX 200 was 7,846.97 on 8 March. Using June option pricing, a trader could sell a Jun 7,950 Call for 170.00 and purchase a Jun 7,800 Put for 165.00 resulting in a credit of 5.00 per spread. The payoff on 20 June expiration appears below.
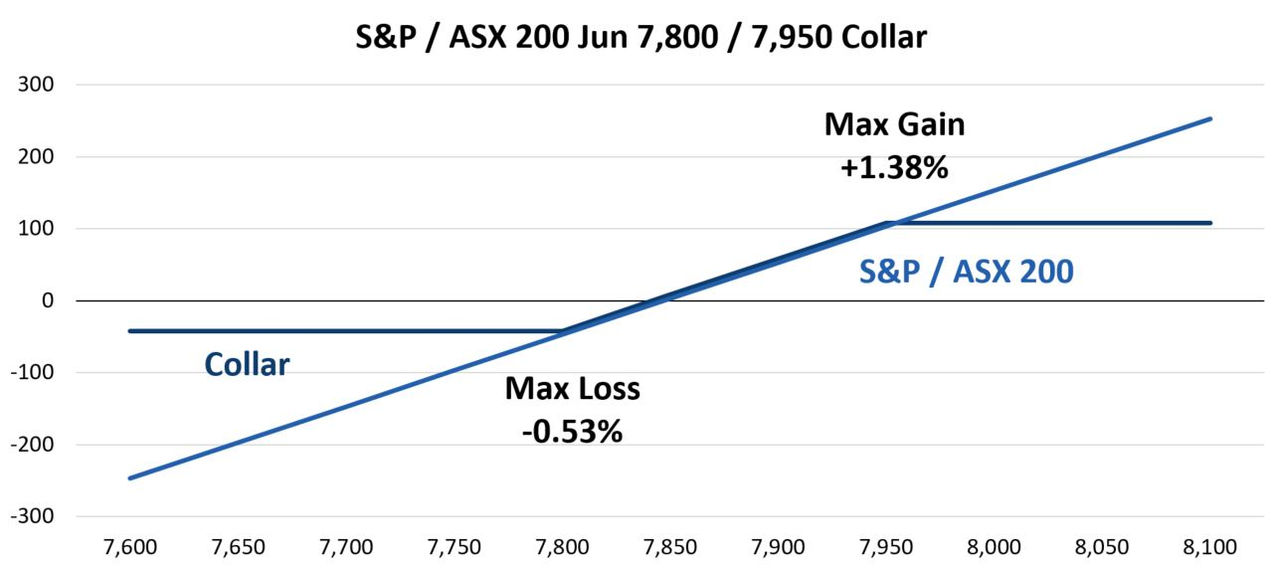
Data source: Bloomberg
This trade takes in a credit, but there is a potential cost through limiting upside performance. In this case, the short call offsets any gains above 7,950 or up 1.38%. On the downside, the maximum loss between trade date and June expiration is down 0.53% or any move below 7,800. The strikes may be adjusted based on how much upside a trader is willing to sacrifice versus desired downside protection.
Structure with partial downside protection and potential upside
An alternative to the traditional collar is a structure that offers partial downside protection, but also allows for more potential upside is demonstrated using option data from 7 March. This was another day when the S&P/ASX 200 reached a new all-time high this year.
With the index at 7,763.71, a trader could sell the Sep 8,050 Put for 145.00 buy Sep 7,700 Put for 250.00 and sell Sep 7,200 Put for 105.00. The net result is a trade that has no cost nor does it take in a credit. The only dollar cost is commissions. The payout at September expiration appears below.

Data source: Bloomberg
This trade does allow for more upside than the first example. Specifically, the profit is limited to +3.69% if the index is over 8050 at expiration. Again, this is the ‘cost’ of putting on a trade that sells a call versus a long position. Downside protection provides a buffer as opposed to total protection below a certain price point. This structure limits losses to 0.82% if the index falls between 7,700 and 7,200. Below 7,200 the short put gains in value, resulting in losses equal to the drop in the S&P / ASX 200.
Covered call – longer dated position
A final trade to guard against losses uses 1 March data, again a day where the index made a new all-time high. Traders generally think of covered calls as an income strategy. However, implementing a longer dated in-the-money covered call position may offer some downside protection.
On 1 March, the S&P / ASX 200 was at 7,745.61. To protect against some downside a trader could sell a Dec 7475 Call for 525.00 against a long equity portfolio. The time value for this option is 254.39. This time value allows for more upside from the combined position. However, just like the second trade above, the trade offers partial downside protection.

Data source: Bloomberg
This trade caps upside performance at up 3.60% which occurs with the index at 8,025. The return in this case is +3.60% as long as the S&P / ASX 200 is above 7,475, which is down 3.50% from where the index was quoted when the trade was priced out. The break-even for this structure is just below 7200 or down 7.18%.
Protection for peace of mind
As discussed at the beginning of this article, stock prices have been slightly higher in 2024. However, there are many potential risks that could put pressure on stocks over the balance of 2024. Having some sort of protection from a down move can offer a bit of peace of mind, but also preserve gains and avoid losses.
Other Insights
This is the third article in a series of trading activity observations in the first half of 2024. To receive these insights via email, please subscribe to the ASX Equity Derivatives monthly newsletter.


About the author
Disclaimer
The views, opinions or recommendations of the author in this article are solely those of the author and do not in any way reflect the views, opinions, recommendations, of ASX Limited ABN 98 008 624 691 and its related bodies corporate (“ASX”). ASX makes no representation or warranty with respect to the accuracy, completeness or currency of the content. The content is for educational purposes only. Examples used are intended to detail the performance of historic trading strategies. Past performance is not a reliable indicator of future performance. The content does not constitute financial advice. Independent advice should be obtained from an Australian financial services licensee before making investment decisions. To the extent permitted by law, ASX excludes all liability for any loss or damage arising in any way including by way of negligence. © Copyright ASX Operations Pty Limited ABN 42 004 523 782. All rights reserved 2024.