Operational performance of Cash Market Clearing and Settlement Services
| June 2026 Quarter | March 2026 Quarter | December 2025 Quarter | |
|---|---|---|---|
| System availability (CHESS) | 100% | 100% | 100% |
| System availability (TAS) | 100% | 100% | 100% |
| Trade registration | |||
| Total trades accepted (ASX) | 58,005,901 | 185,166,040 | 161,733,267 |
| Total trades accepted (Cboe) | 17,871,432 | 57,954,774 | 49,597,941 |
| Total trades accepted (NSX) | 28 | 86 | 141 |
| Total trades accepted (SSX) [1] | 0 | 0 | 0 |
| Daily average trades across all AMOs | 3,793,868 | 3,921,305 | 3,302,052 |
| Highest daily trade registration across all AMOs | 4,697,574 | 5,660,609 | 4,147,217 |
| Highest consecutive 2 days trade registration across all AMOs | 8,610,986 | 10,118,485 | 7,834,518 |
| Clearing | |||
| Daily average traded value (on and off market) | $10.54 billion | $11.67 billion | $10.73 billion |
| Daily average cleared value* | $8.26 billion | $7.94 billion | $7.66 billion |
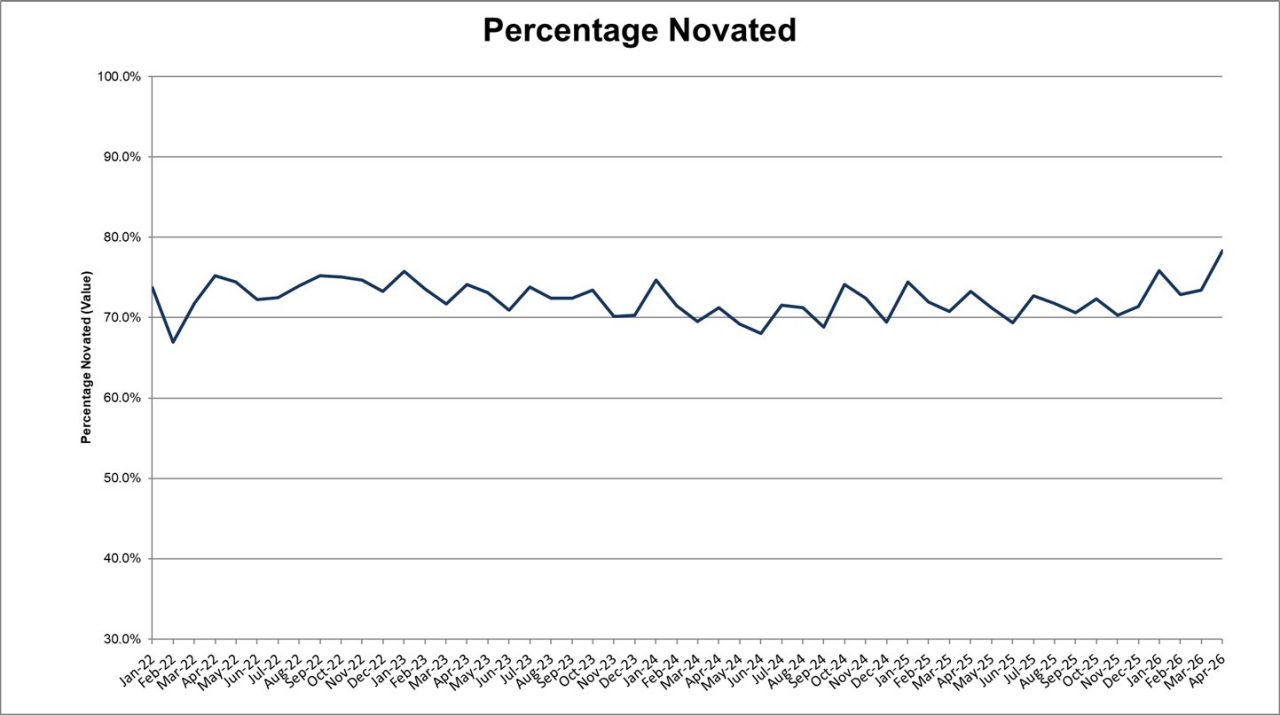
| Percentage novated* | 78.3% | 74.0% | 71.4% |
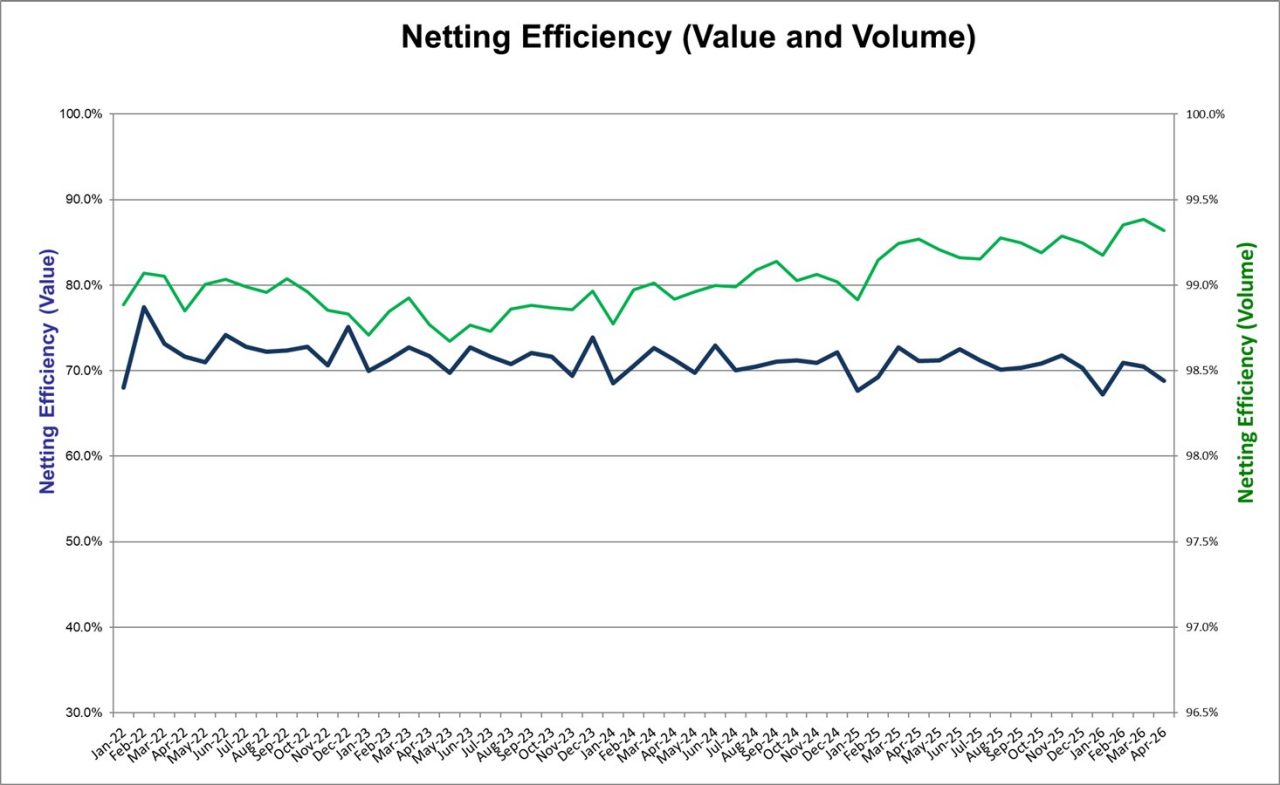
| Netting efficiency (value)* | 68.5% | 70.6% | 70.5% |
| Netting efficiency (volume)* | 99.3% | 99.4% | 99.2% |
| Daily average cleared value post-netting | $3.29 billion | $3.53 billion | $3.11 billion |
| Batch settlement | |||
| Daily average settled value (including non-novated) | $17.88 billion | $16.79 billion | $17.37 billion |
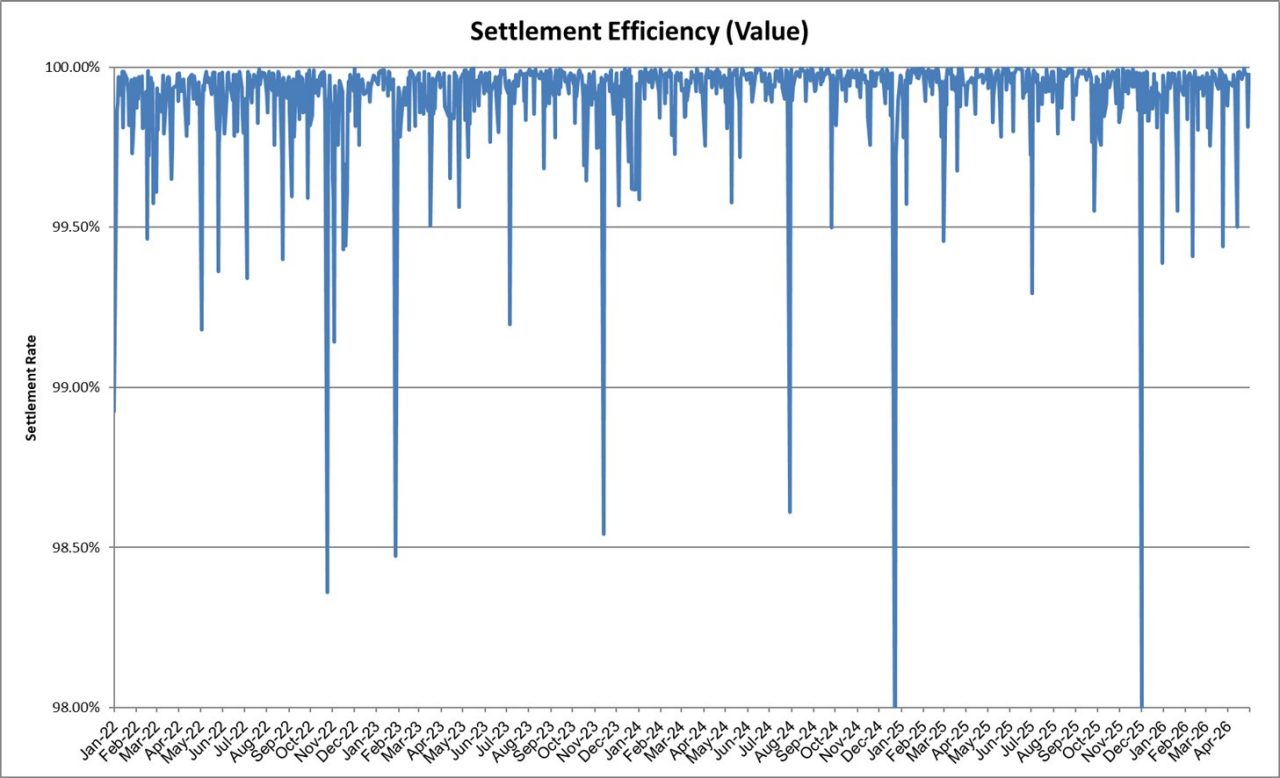
| Settlement efficiency (value) | 99.94% | 99.90% | 99.89% |
| Average daily CHESS fail rate (% rescheduled to the next settlement date) | 0.120% | 0.148% | 0.256% |
| Average value based fail rate (% rescheduled to the next settlement date) | 0.063% | 0.083% | 0.111% |
As of March 2022 quarter, Traded Volume includes transactions (for all AMOs) with settlement status “I” (e.g. crossings, informational)
[1] As at 30 April 2026
As of March 2022 quarter, traded volume includes transactions (for all AMOs) with settlement status “I” (e.g. crossings, informational)