
Trading a bullish 2026 outlook using S&P/ASX 200 index options
- Mon 09 February 2026
- 3 MIN READ

The S&P/ASX 200 managed a third year of positive returns in 2025. Despite some concerns about the state of the world, the big option trades using longer dated contracts we found in January appear to be looking for continuation of this upward trend in 2026. A couple of trades using options expiring on 18 June 2026 and a couple appear to be focusing on a full year outlook using options expiring on 17 December 2026 are discussed below. We begin by analysing trades using options expiring in June 2026.
June expiry trades
On 13 January, with the S&P/ASX 200 at 8,807, a trader initiated a bullish spread using put options. They sold 125 of the Jun 8,950 Puts for 319.00 and completed the bullish spread by purchasing the same number of Jun 8,800 Puts for 250.00 resulting in a credit of 69.00 points. The payoff at expiration appears in the graphic below.
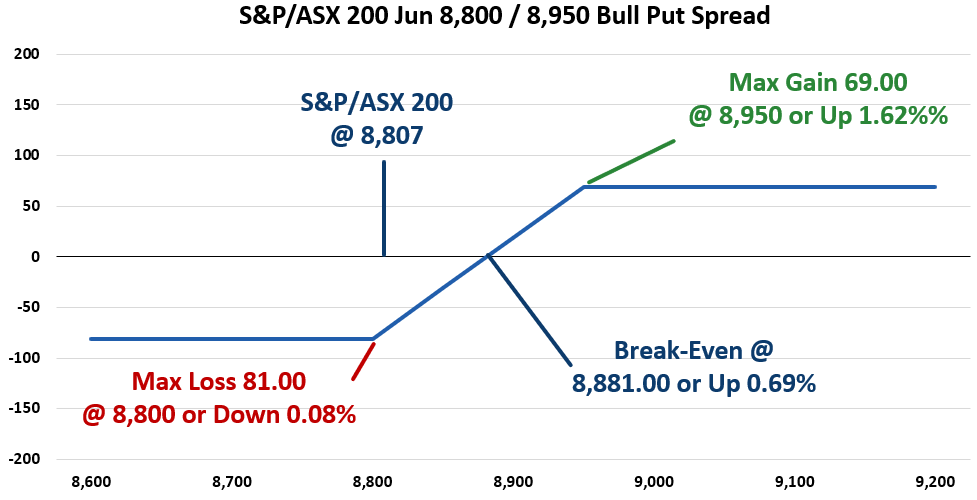
Data sources: Bloomberg and author calculations
Note the lower strike price is only seven points below where the S&P/ASX 200 was when the trade was initiated. If the market is down by 0.08% or more at June expiration, this trade will lose 81.00 points. Netting the credit of 69.00 with the worst-case scenario of the index below 8,800 at expiration, results in the loss of 81.00 points. Also, this trade would experience a partial loss if the index is higher than the lower strike of 8,800, but below the break-even level of 8,881 (0.69% higher than the market at execution).
A second bullish trade was initiated on 2 January with the S&P/ASX 200 at 8,728. A trader used June calls to construct a very bullish outlook, one that, in my opinion, a number of traders may not agree with. This trade purchased 100 Jun 9,800 Calls for 18.00 each and sold 100 Jun 10,000 Calls for 13.00 resulting in a cost of 5.00 points per bull call spread.
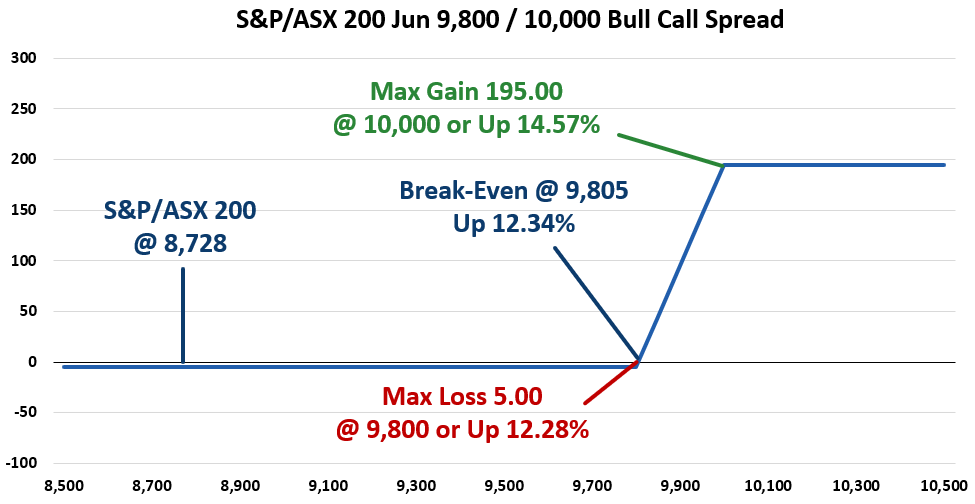
Data sources: Bloomberg and author calculations
The maximum loss of 5.00 for this trade occurs if the S&P/ASX 200 fails to rise by 12.28% over the few months. Break-even is around the same magnitude higher at up 12.34%. Finally, the maximum profit for this trade is realized if the S&P/ASX reaches the 10,000 level or is up by 14.57%. This results in a profit of 195.00 points, a very nice return for a small 5.00-point investment.
For this trader to realize the maximum profit of 195.00 points, a 14.57% rally in about 110 trading days is required. We looked at historical data to see how often the index rose this much or more in 110 trading days and found that 368 110-day periods experienced a gain of over 14.57%. This result occurred when analysing a total of 6,487 rolling 110-day periods starting in the year 2000. That’s about 5.67% of the time.
December expiry trades
The first bullish trade using December options was executed on 15 January with the S&P/ASX 200 at 8,820. A trader sold 240 Dec 9,450 Puts for 720.30 and purchased 240 Dec 8,350 Puts for 241.40 resulting in a credit of 478.90.
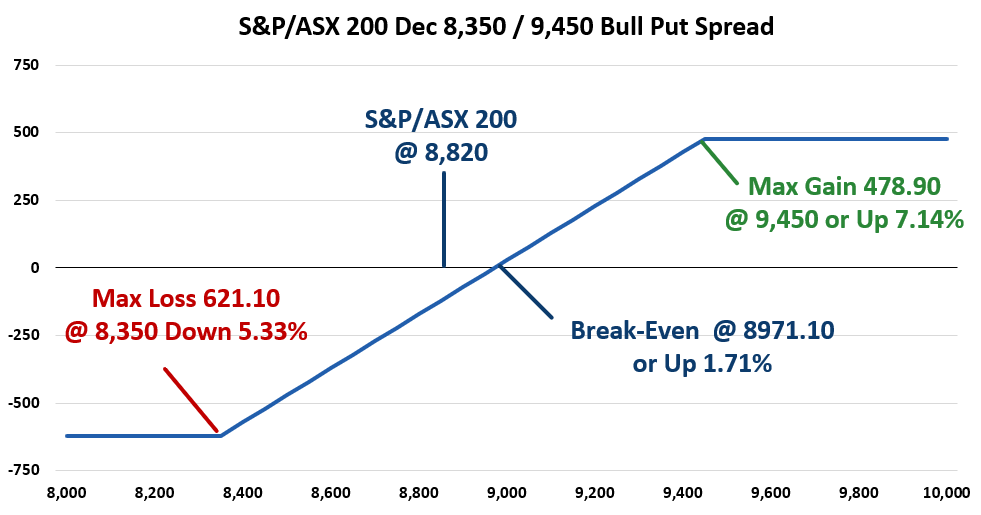
Data sources: Bloomberg and author calculations
To break even at expiration, the index should be 1.71% higher than when the trade was executed. The maximum gain for this bull put spread is the 478.90 credit, which is realized if the market is 7.14% higher. The worst-case scenario is a drop of 5.33% and a loss of 621.10. Over the past three years, the S&P/ASX 200 has risen in the 6% to 7% range. This trade appears to hope for a repeat of the past three years in 2026.
A final trade using December 2026 options was executed on 28 January with the S&P/ASX 200 at 8,934. This trade is very similar to the other December trade, but larger in size and using slightly different strike prices. This trade sold 470 Dec 9,500 Puts for 688.90 and purchased 470 Dec 8,450 Puts for 241.00 resulting in a credit of 447.90.
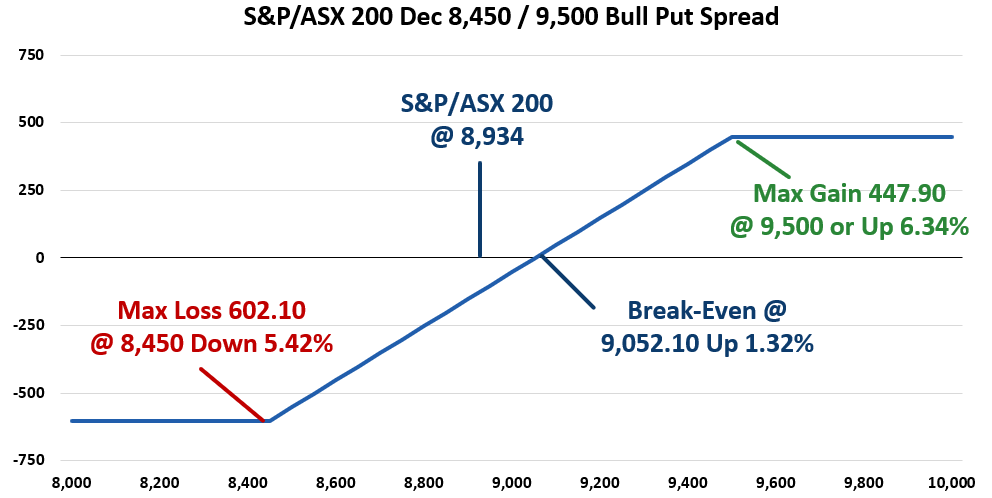
Data sources: Bloomberg and author calculations
This trade has a similar risk profile to the other December trade, realizing a maximum profit of 447.90 with the market higher by 6.34% or more between the trade date and option expiration. Break even for this trade is at 9,051.10 or 1.32% higher. The worst-case scenario is a drop of 5.42% resulting in a loss of 602.10 per spread.
Other insights
To receive regular insights via email, please subscribe to the ASX Equity Derivatives monthly newsletter.
Insights
Equity options trading observations and insights
ASX have partnered with Dr Russell Rhoads to create a series of articles which provide observations and insights for options trading.
About the author
Disclaimer
The views, opinions or recommendations of the author in this article are solely those of the author and do not in any way reflect the views, opinions, recommendations, of ASX Limited ABN 98 008 624 691 and its related bodies corporate (“ASX”). ASX makes no representation or warranty with respect to the accuracy, completeness or currency of the content. The content is for educational purposes only. Examples used are intended to detail the performance of historic trading strategies. Past performance is not a reliable indicator of future performance. The content does not constitute financial advice. Independent advice should be obtained from an Australian financial services licensee before making investment decisions. To the extent permitted by law, ASX excludes all liability for any loss or damage arising in any way including by way of negligence. © Copyright ASX Operations Pty Limited ABN 42 004 523 782. All rights reserved 2026.