Operational performance of Cash Market Clearing and Settlement Services
| September 2026 Quarter [1] | June 2026 Quarter | March 2026 Quarter | |
|---|---|---|---|
| System availability (CHESS) | 100% | 100% | 100% |
| System availability (TAS) | 100% | 100% | 100% |
| Trade registration | |||
| Total trades accepted (ASX) | 130,852,452 | 189,522,158 | 185,166,040 |
| Total trades accepted (TMX) | 40,622,269 | 57,812,544 | 57,953,999 |
| Total trades accepted (NSX) | 40 | 105 | 86 |
| Total trades accepted (SSX) | 0 | 0 | 0 |
| Daily average trades across all AMOs | 3,897,154 | 3,989,271 | 3,921,292 |
| Highest daily trade registration across all AMOs | 5,051,814 | 4,903,746 | 5,660,609 |
| Highest consecutive 2 days trade registration across all AMOs | 9,638,066 | 9,573,649 | 10,118,485 |
| Clearing | |||
| Daily average traded value (on and off market) | $10.52 billion | $11.71 billion | $11.67 billion |
| Daily average cleared value | $7.73 billion | $8.43 billion | $8.62 billion |
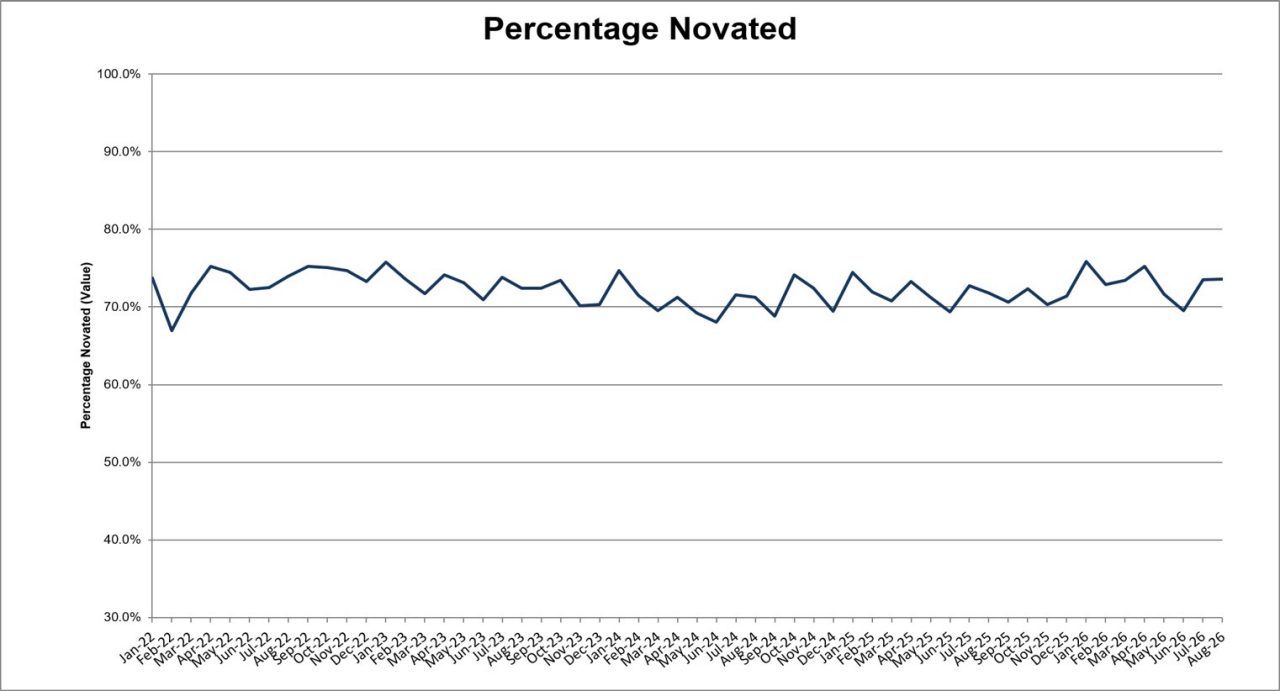
| Percentage novated | 73.54% | 72.13% | 74.04% |
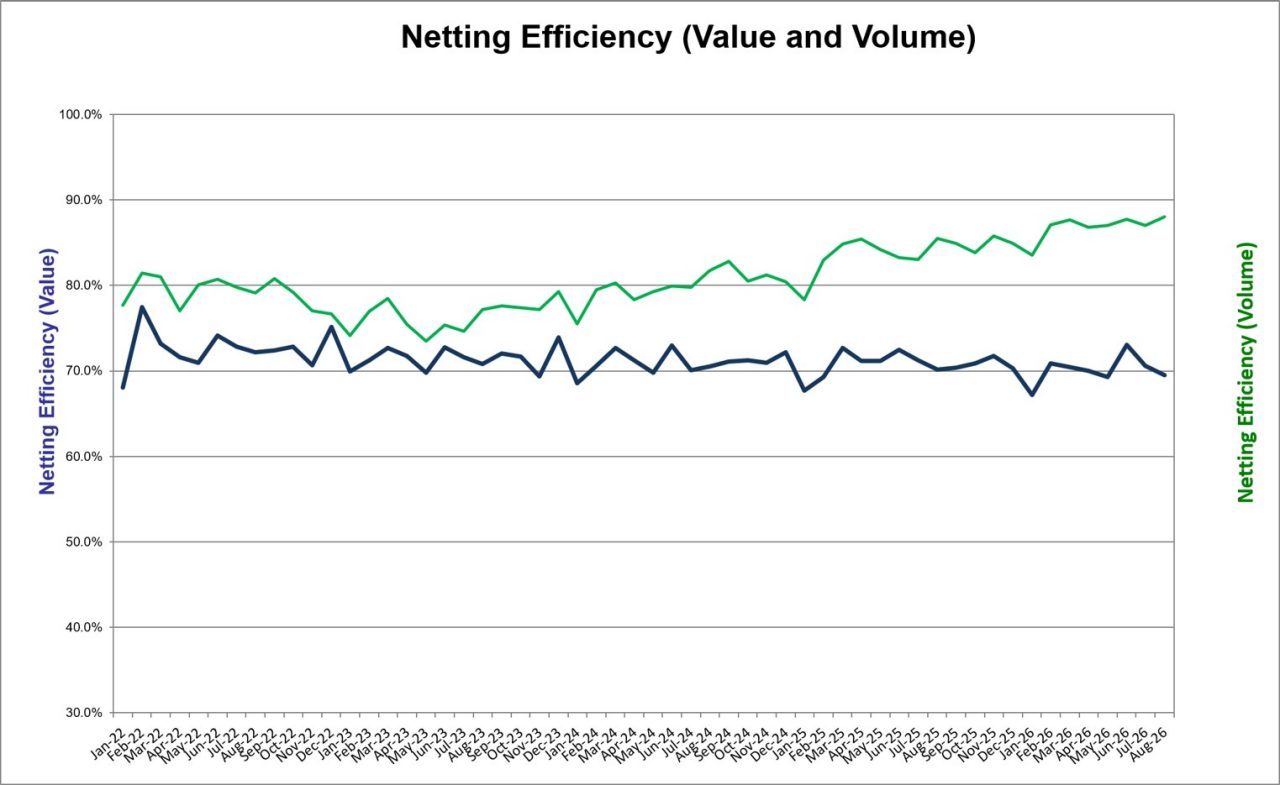
| Netting efficiency (value) | 70.69% | 70.77% | 70.38% |
| Netting efficiency (volume) | 99.37% | 99.36% | 99.31% |
| Daily average cleared value post-netting | $3.15 billion | $3.40 billion | $3.53 billion |
| Batch settlement | |||
| Daily average settled value (including non-novated) | $16.63 billion | $18.75 billion | $18.17 billion |
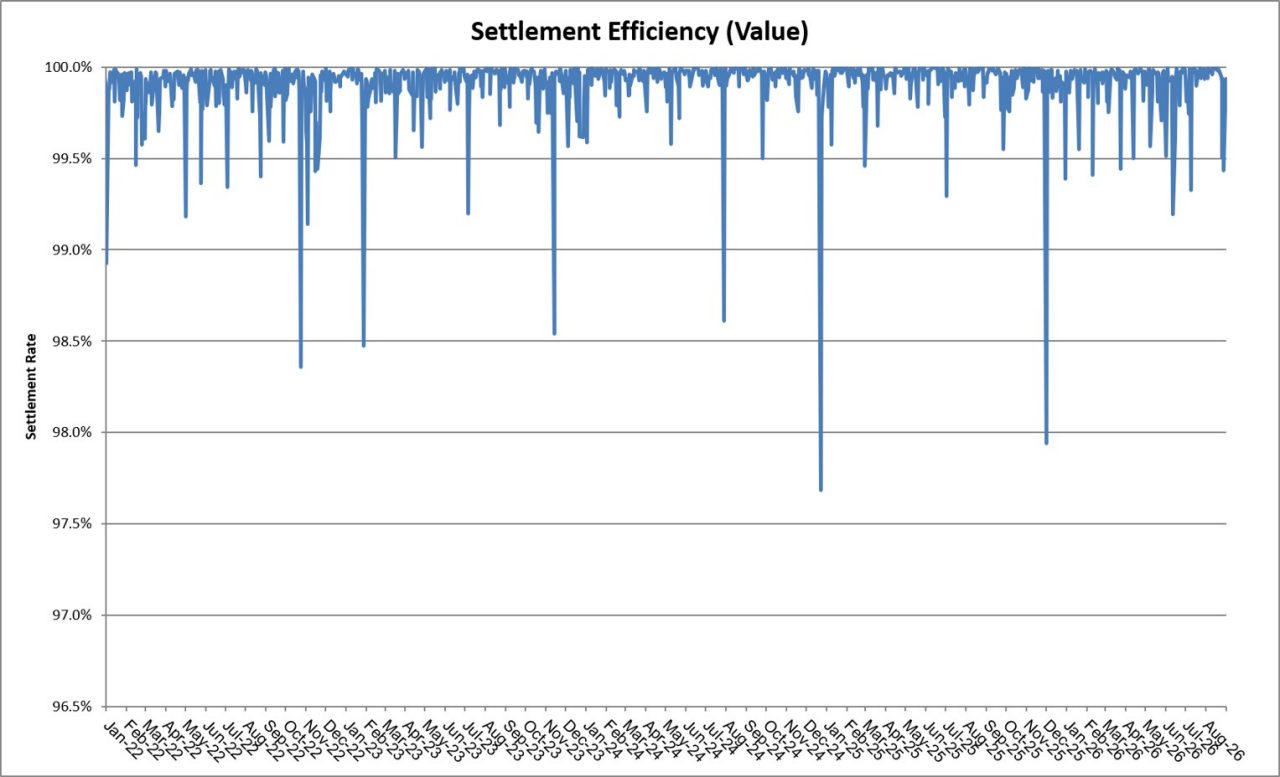
| Settlement efficiency (value) | 99.92% | 99.90% | 99.90% |
| Average daily CHESS fail rate (% rescheduled to the next settlement date) | 0.11% | 0.12% | 0.15% |
| Average value based fail rate (% rescheduled to the next settlement date) | 0.08% | 0.10% | 0.08% |
As of March 2022 quarter, Traded Volume includes transactions (for all AMOs) with settlement status “I” (e.g. crossings, informational)
[1] As at Monday 31 August 2026
As of March 2022 quarter, traded volume includes transactions (for all AMOs) with settlement status “I” (e.g. crossings, informational)