
S&P/ASX 200 topping 9,000 brings out some smart hedgers
- Mon 09 March 2026
- 5 MIN READ

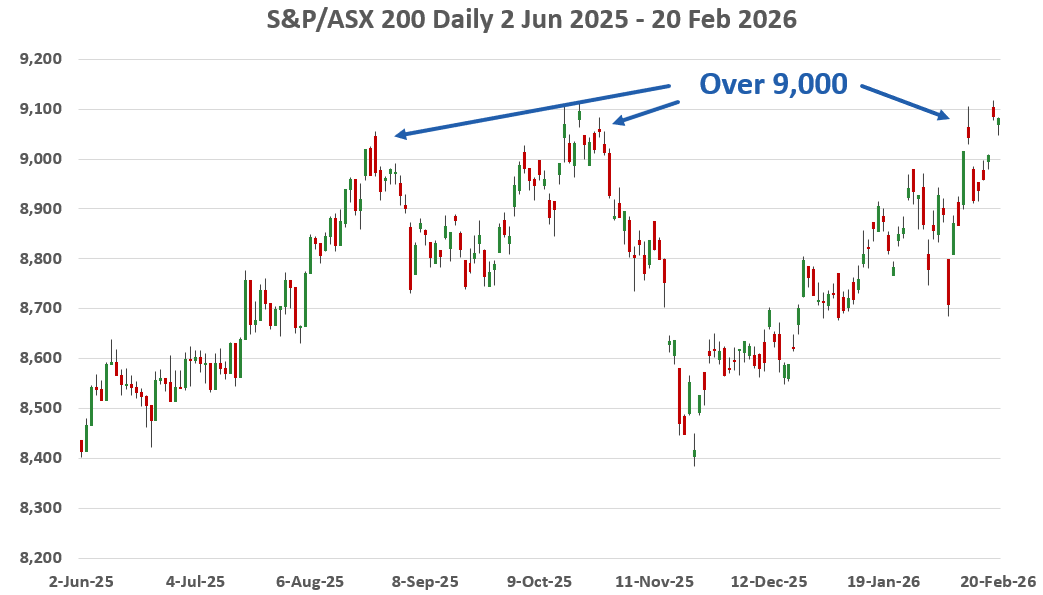
The S&P/ASX 200 moved above 9,000 several times in 2025, before pulling back on each occasion. In February, the index again closed above the 9,000 mark. Each break above this level prompted some investors to hedge their portfolios. The following hedging trades are combined with a long portfolio that reflects the performance of the underlying index.
Data sources: Bloomberg and author calculations
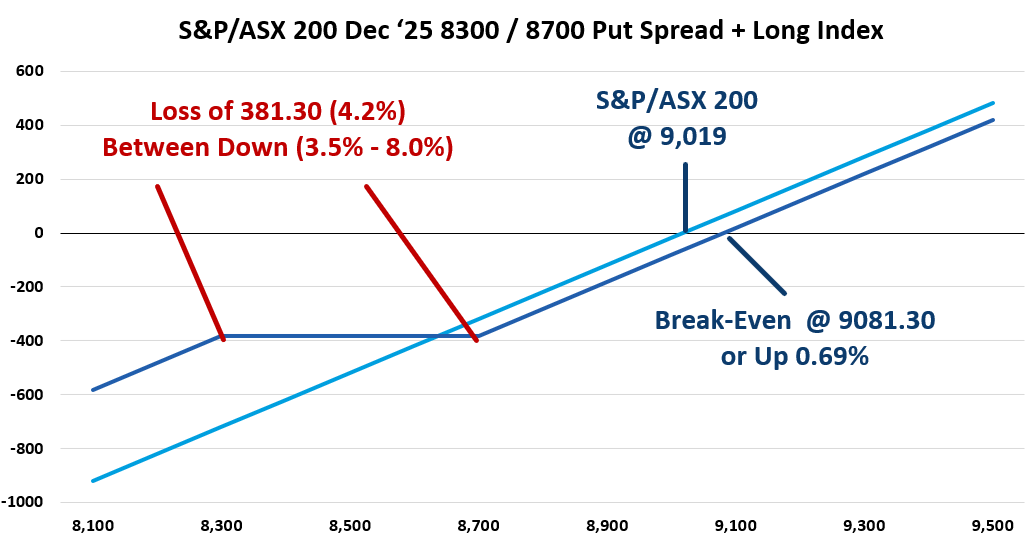
The S&P/ASX 200 first closed above 9,000 on 21 August 2025. In response, a trader initiated a bearish spread using Puts. This trade can be speculative or as a hedge. We will assume this is a hedge and demonstrate the outcome based on combining this spread with a long S&P/ASX 200 portfolio. The specific trade purchased the S&P/ASX 200 December 8,700 Put for 128.00 and sold the S&P/ASX 200 December 8,300 Put for 65.70, resulting in a net cost of 62.30. The payoff diagram below shows the payoff at expiration for the bear Put spread combined with a long position in the S&P/ASX 200.
Data sources: Bloomberg and author calculations
This trade sacrifices 0.69% of upside due to the cost of the spread, highlighted by the break-even level at 9,081.30. This spread guards against losses between 8,700 and 8,300, or down 3.5% to 8.0%. The long 8,700 Put offsets losses in this range. The loss at expiration would be 4.2% for the combined long index and Put spread position. Below the lower 8,300 strike, losses would accumulate as the short Put would offset the long 8,700 Put.
It appears this trade was exited early as the same size trade was executed on 21 November 2025, with the S&P/ASX 200 ’25 8,700 Put sold for 309.30 and the 8,300 Put purchased at 104.60, taking in a credit of 204.70. Combined with the initial cost of 62.70, this trade generated a profit of 142.40. This exit was timely as December settlement was 8,585.20 which would have resulted in the trade settlement value of 114.80 and a profit of only 52.50.
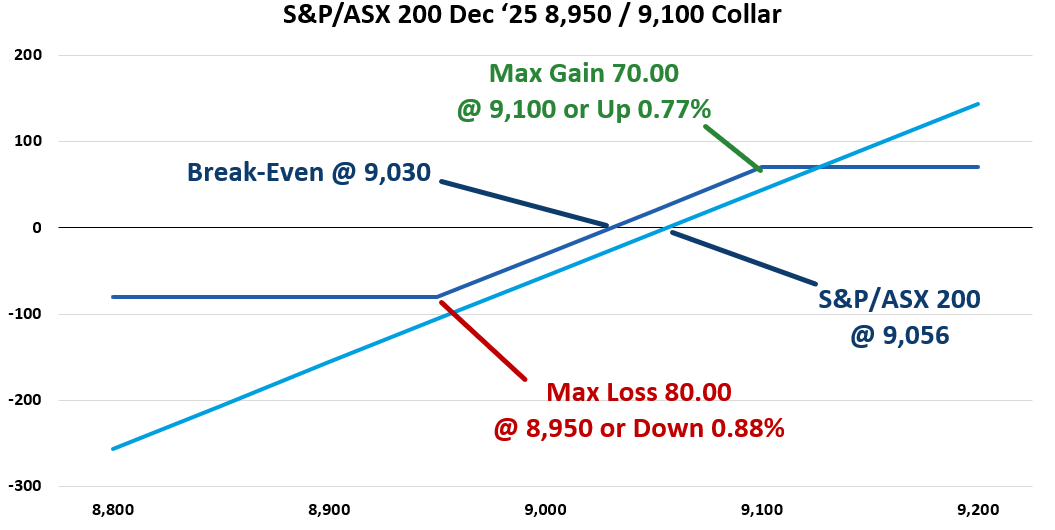
In late October 2025, the S&P/ASX 200 spent several days over the 9,000 level before shortly giving up over 600 points. On 27 October 2025, with the index at 9056, a trader purchased the S&P/ASX 200 December 8,950 Put for 116.00 and sold the S&P/ASX 200 December 9, 100 Call at 142.00 for a net credit of 26.00. When combined with a long position in the underlying, purchasing a Put and selling a call results in a collar. The payout at expiration compared to a long position in the index appears below.
Data sources: Bloomberg and author calculations
If held to expiration, this collar sacrifices gains over 0.77%, but guards against losses greater than 0.88%. Additionally, if the collar is held to expiration and the index is between 8,950 and 9,100, both options would expire with no value and this trade would realize a profit of 26.00 or approximately 0.28% more than the index performance. Over 9,100 and profits from the long portfolio would be offset by the short call. However, a move to the downside, below 8,950, results in losses being offset by the long Put.
This trade was executed on 27 October 2025 based on volume and a change in open interest. It appears the 8,950-strike Put was sold at 526.60 on 21 November 2025, the same day as the first trade discussed in this posting. Also, based on volume analysis, it appears the short 9,100 call position was not exited and likely expired out of the money on 18 December 2025. The net result is a profit of 552.60 when summing the proceeds from the sale with the 26.00 credit received when the trade was initiated.
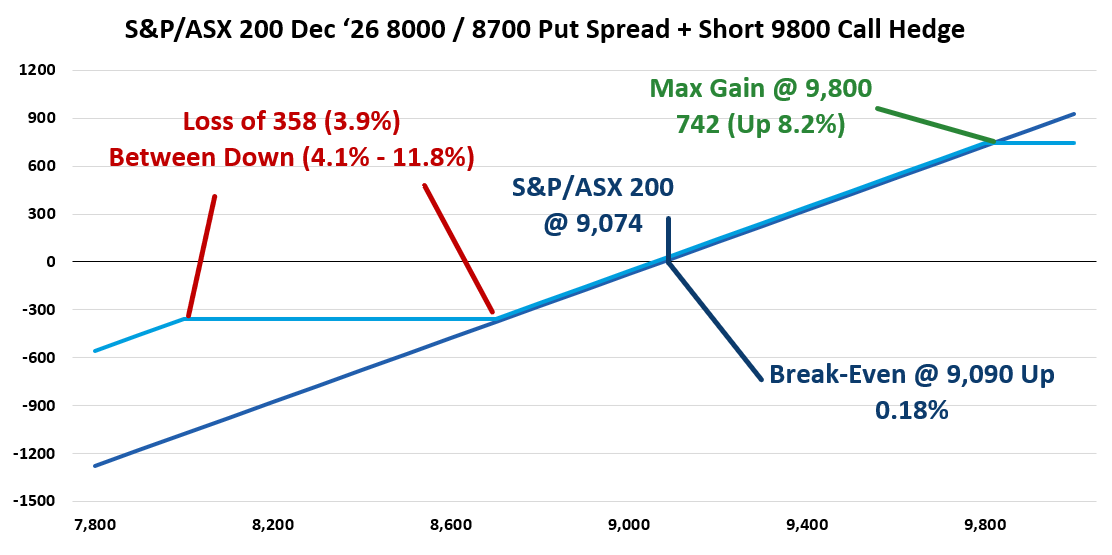
The index’s third move over 9,000 occurred in February 2026. On 20 February 2026, with the index at 9,074, a trader purchased the S&P/ASX 200 December 8,700 Puts for 275.00, sold the S&P/ASX 200 December 8,000 Puts for 140.00 and completed this spread by selling the S&P/ASX 200 December 9,800 Call for 151.00. The result was a credit of 16.00 per spread. This spread can offer a buffer on the downside, but does sacrifice upside. However, as seen below there is plenty of room for the S&P/ASX 200 to run to the upside.
Data sources: Bloomberg and author calculations
Break-even for this trade when combined with a long position in the index is 16.00 points higher, or a small 0.18% gain. At any settlement level between 8,600 and 9,800 the portfolio’s performance improves by the credit received for the spread. Gains are capped at 8.2% at 9,800 and higher due to the short call. On the downside, between 8,700 and 8,000 or down 4.1% to 11.8%, the portfolio would be down by 3.9%. Finally, below 8,000 losses will accumulate again, but the hedged portfolio would outperform the index by 7.9%.
Other insights
To receive regular insights via email, please subscribe to the ASX Equity Derivatives monthly newsletter.
Insights
Equity options trading observations and insights
ASX have partnered with Dr Russell Rhoads to create a series of articles which provide observations and insights for options trading.
About the author
Disclaimer
The views, opinions or recommendations of the author in this article are solely those of the author and do not in any way reflect the views, opinions, recommendations, of ASX Limited ABN 98 008 624 691 and its related bodies corporate (“ASX”). ASX makes no representation or warranty with respect to the accuracy, completeness or currency of the content. The content is for educational purposes only. Examples used are intended to detail the performance of historic trading strategies. Past performance is not a reliable indicator of future performance. The content does not constitute financial advice. Independent advice should be obtained from an Australian financial services licensee before making investment decisions. To the extent permitted by law, ASX excludes all liability for any loss or damage arising in any way including by way of negligence. © Copyright ASX Operations Pty Limited ABN 42 004 523 782. All rights reserved 2026.