
Index option traders benefiting from a range-ound S&P/ASX 200
- Wed 25 November 2026
- 5 MIN READ

In early September, the S&P/ASX 200 fell from over 9,000.00 to a historically narrow range. This trading activity saw the index remain below 8,850.00 and above 8,600.00 for the balance of September through the third week of October. One of the benefits of using options is the ability to use different strategies in both trending and non-trending markets, with outcomes depending on the structure used and market conditions. The chart below shows this neutral price activity along with labels showing when the two short and one long trade discussed below were executed.
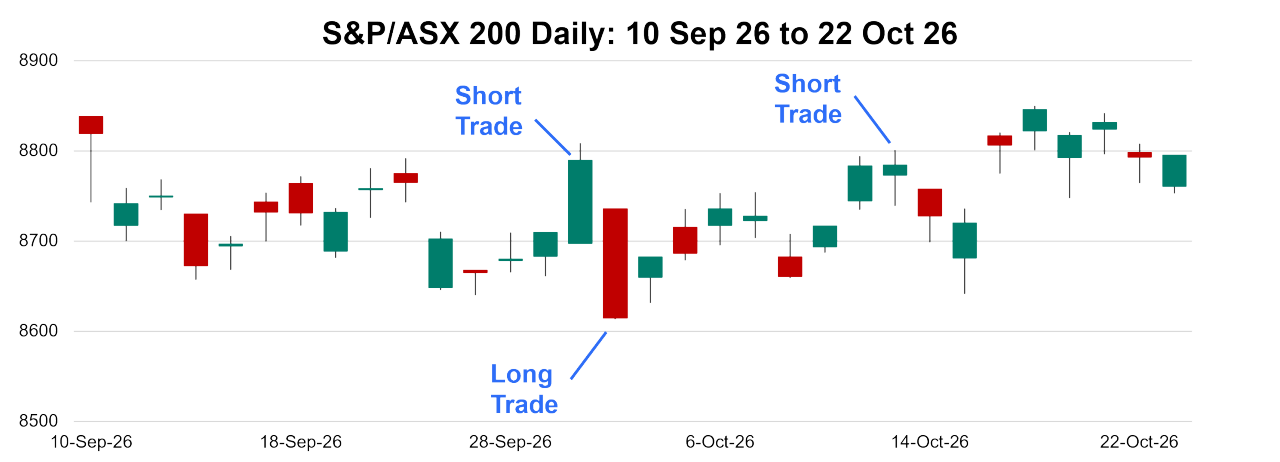
Data sources: Bloomberg
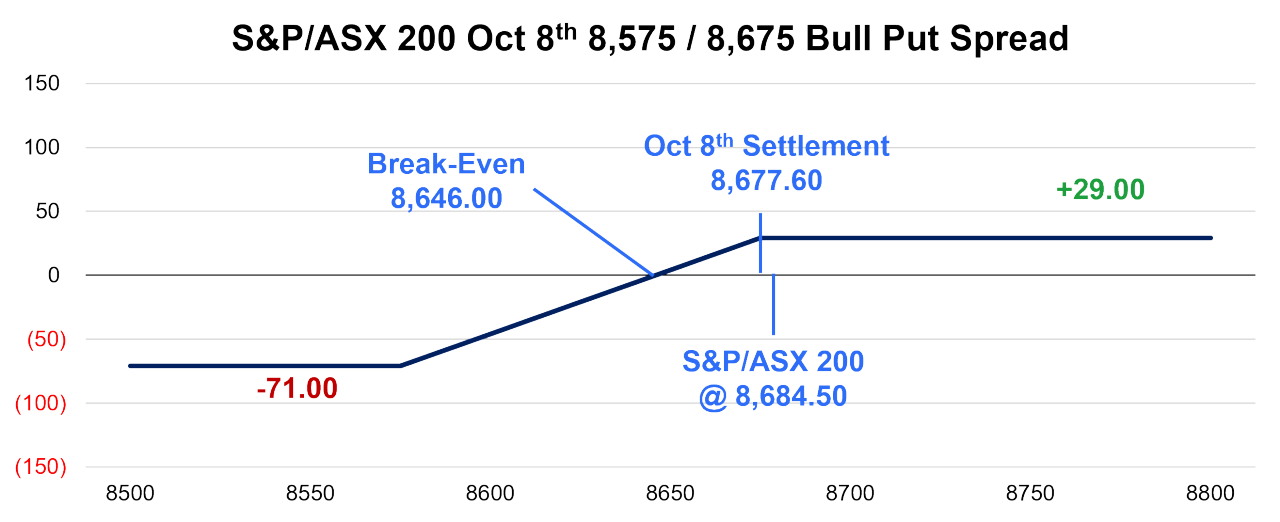
The long trade occurred on 1 October with the S&P/ASX 200 at 8,684.50. This long trade used a bull put spread structure, selling the S&P/ASX 200 8 October 8,675 put for 49.00 and purchasing the 8 October 8,575 put for 20.00, taking in a credit of 29.00. The payoff at expiration appears below.
Data sources: Bloomberg and author calculations
The best-case scenario for this trade at expiration is settlement at 8,675.00 or higher. In this scenario, the profit is equal to the credit of 29.00 points. To the downside, the trade gives up that credit below 8,675.00 with a maximum loss of 71.00 points at a settlement value of 8,575.00 or lower. Finally, the break-even point is 8,646.00, which is 38.50 points below the index level at trade initiation.
This was a bullish trade structure, but there is a slight neutral buffer for this trade as the short strike for this put spread is 9.50 lower than where the index was quoted when the trade was executed. This buffer affected the trade outcome as the index settlement value was 8,677.60 or 6.90 points lower than the index at trade initiation and 2.60 higher than the short put strike.
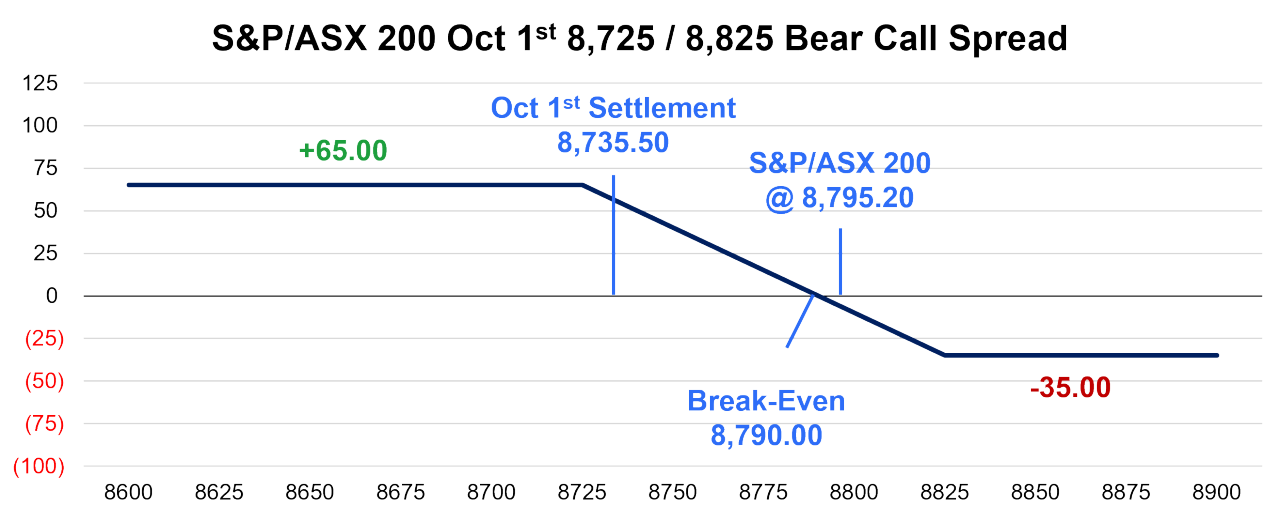
The day before this short trade the S&P/ASX 200 was at the higher end of the range. On 30 September, with the index at 8,795.20, a trade initiated a bearcall spread expiring the following day. The trade specifically sold the S&P/ASX 200 1 October 8,725 call for 72.00 and purchased the 1 October 8,825 call for 7.00, resulting in a credit of 65.00. The payoff, if held through settlement the following day, appears below.
Data sources: Bloomberg and author calculations
This trade’s break-even, at 8,790.00, is 5.20 lower than where the market was quoted when the trade was executed. The maximum loss for this trade is 35.00 points, which occurs at 8,825.00 or higher and the maximum profit occurs at 8,725.00 or lower.
The result for this bearish trade was a partial profit as the short 8,725 call was 10.50 in the money. This figure is based on settlement of 8,735.50 and the net result was a profit of 54.50, determined by subtracting the 10.50 value for the short call from the credit of 65.00.
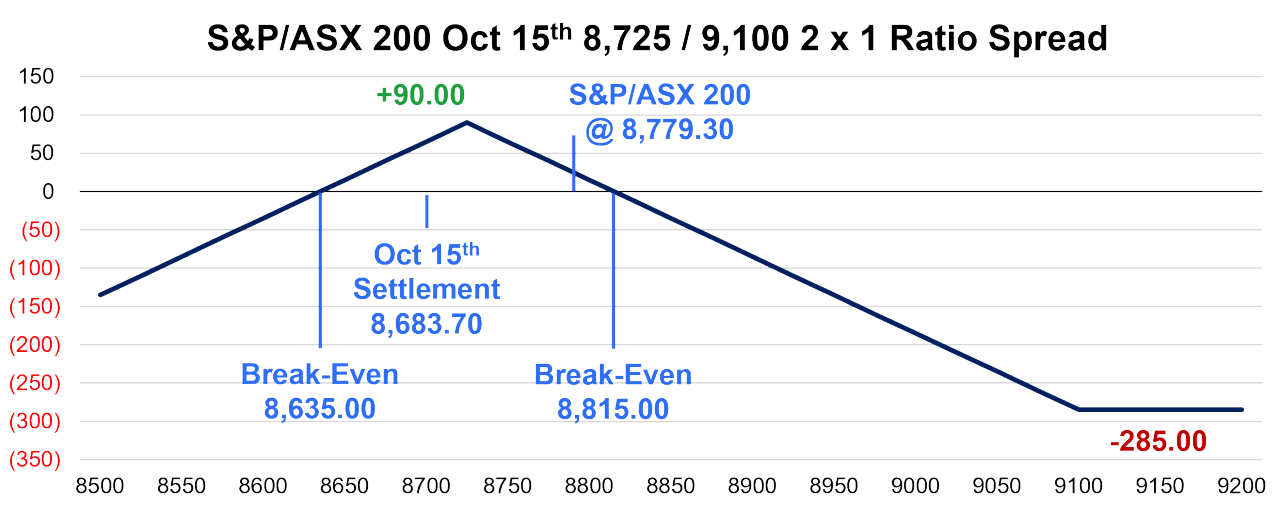
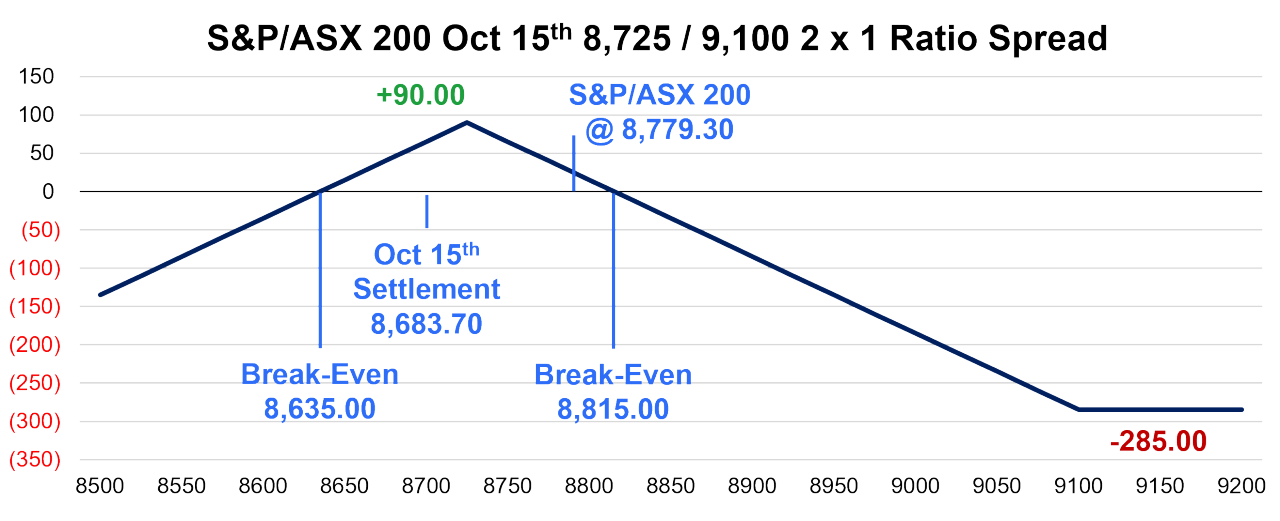
A final trade implemented during the narrow trading range for the S&P/ASX 200 occurred on 12 October. The index was at 8,779.30, near the higher end of the range, when a trader initiated a bearish ratio spread using standard third-Friday puts expiring on 15 October. This trade purchased one S&P/ASX 15 October 9,100 put for 299.00 and sold two S&P/ASX 15 October 8,725 puts for 7.00 each, resulting in a cost of 285.00 per ratio spread.
Data sources: Bloomberg and author calculations
This trade has a slightly neutral bias as there is a little upside between where the index was quoted at trade execution and the upper break-even point. Most of the range of profitability is to the downside, with settlement at 8,725.00 being the best-case scenario and a profit of 90.00 points per spread. There is risk associated with a lower move, with a second break-even level at 8,635.00.
This trade resulted in a partial profit at expiration, the net result for this trade is a profit of 48.70 per ratio spread. This is calculated with the long 9,100 put worth 416.30 combined with subtracting 82.60 for the short two 8,725 puts and 285.00 for the initial cost.
These three trades illustrate how the selected options structures performed when the S&P/ASX 200 remains within a narrow range. By positioning for modest gains or declines, the selected strategies produced profits during this historical period without a sustained market trend. These results are specific to the trades described and are not indicative of future performance. The bull put spread achieved its maximum profit despite a small decline in the index, while the two bearish strategies produced partial profits. Each outcome highlights the importance of strike selection, settlement values and understanding the full payoff structure, particularly the additional downside risk associated with the put ratio spread.
Data sources: Bloomberg and author calculations
This trade has a slightly neutral bias as there is a little upside between where the index was quoted at trade execution andthe upper break-even point. Most of the range of profitability is to the downside, with settlement at 8,725.00 being the best-case scenario and a profit of 90.00 points per spread. There is risk associated with a lower move, with a second break-even level at 8,635.00.
This trade resulted in a partial profit at expiration, the net result for this trade is a profit of 48.70 per ratio spread. This is calculated with the long 9,100 put worth 416.30 combined with subtracting 82.60 for the short two 8,725 puts and 285.00 for the initial cost.
These three trades illustrate how the selected options structures performed when the S&P/ASX 200 remains within a narrow range. By positioning for modest gains or declines, the selected strategies produced profits during this historical period without a sustained market trend. These results are specific to the trades described and are not indicative of future performance. The bull put spread achieved its maximum profit despite a small decline in the index, while the two bearish strategies produced partial profits. Each outcome highlights the importance of strike selection, settlement values and understanding the full payoff structure, particularly the additional downside risk associated with the put ratio spread.
Other insights
To receive regular insights via email, please subscribe to the ASX Equity Derivatives monthly newsletter.
Insights
Equity options trading observations and insights
ASX has partnered with Dr Russell Rhoads to create a series of articles which provide observations and insights for options trading.
About the author
Disclaimer
The views, opinions or recommendations of the author in this article are solely those of the author and do not in any way reflect the views, opinions, recommendations, of ASX Limited ABN 98 008 624 691 and its related bodies corporate (“ASX”). ASX makes no representation or warranty with respect to the accuracy, completeness or currency of the content. The content is for educational purposes only. Examples used are intended to detail the performance of historic trading strategies. Past performance is not a reliable indicator of future performance. The content does not constitute financial advice. Independent advice should be obtained from an Australian financial services licensee before making investment decisions. To the extent permitted by law, ASX excludes all liability for any loss or damage arising in any way including by way of negligence. © Copyright ASX Operations Pty Limited ABN 42 004 523 782. All rights reserved 2026.