
SMSFs under the microscope
- Thu 10 September 2026
- 5 MIN READ
Getting the balance right between income, growth and capital preservation as investment horizons widen.
Key points
- Using data from the Australian Taxation Office and Shaw and Partners, this article examines what Self-Managed Superannuation Funds (SMSFs) own.
- SMSF investors tend to have a smaller allocation to shares and a higher allocation to cash compared to other forms of superannuation.
- Do not read this article as a recommendation to establish an SMSF or invest in companies mentioned. Like all investment structures, SMSFs have risks. Do further research of your own or talk to a licensed financial adviser or SMSF expert before acting on themes in this article.

Australia’s SMSFs now hold over A$1 trillion in assets. [1] The pool of funds in SMSFs has grown 80% over the past 10 years, as the chart below shows.
At over A$1 trillion, SMSFs now represent around one quarter of Australia’s total superannuation assets. [2] This makes SMSFs one of the most significant pools of capital in the country.
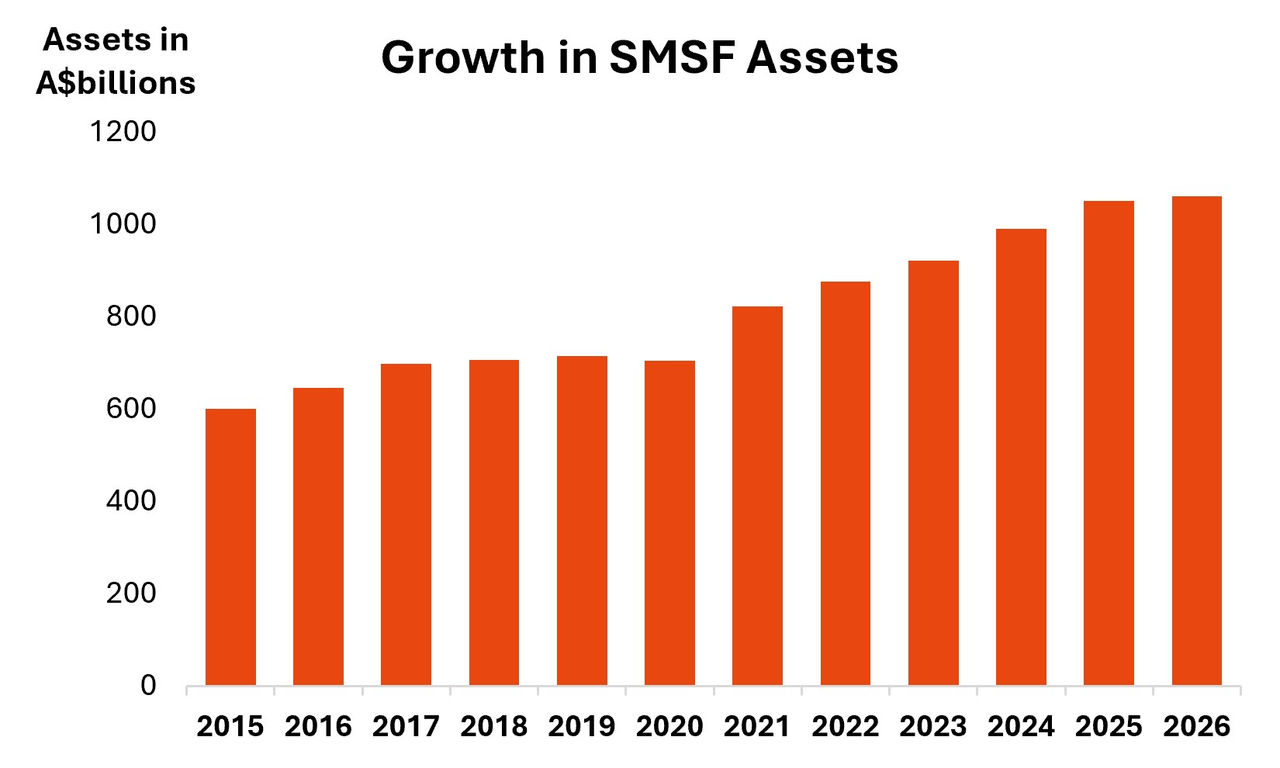
Source: ATO Self-Managed Super Report March 2026, Shaw and Partners Asset Management
Not only has the pool of assets in the SMSF sector grown dramatically, but the wealth held within the average fund has also increased significantly.
According to Shaw and Partners’ internal analysis of ATO SMSF data, in 2015, average assets per SMSF were at around A$1.06 million per fund. Fast forward to 2026, average assets are at around A$1.58 million per fund. That’s growth of almost 50% in SMSF balances.
For investors, while the headline number for SMSF assets is huge, it’s the details that are compelling when Australians look to take a more active role in managing their retirement savings. Perhaps the most interesting insight is not how much SMSFs own. It is what they own.
The great SMSF portfolio
If you want to understand how some of Australia's most engaged investors are positioning for the future, SMSF asset allocation data provides a fascinating insight.
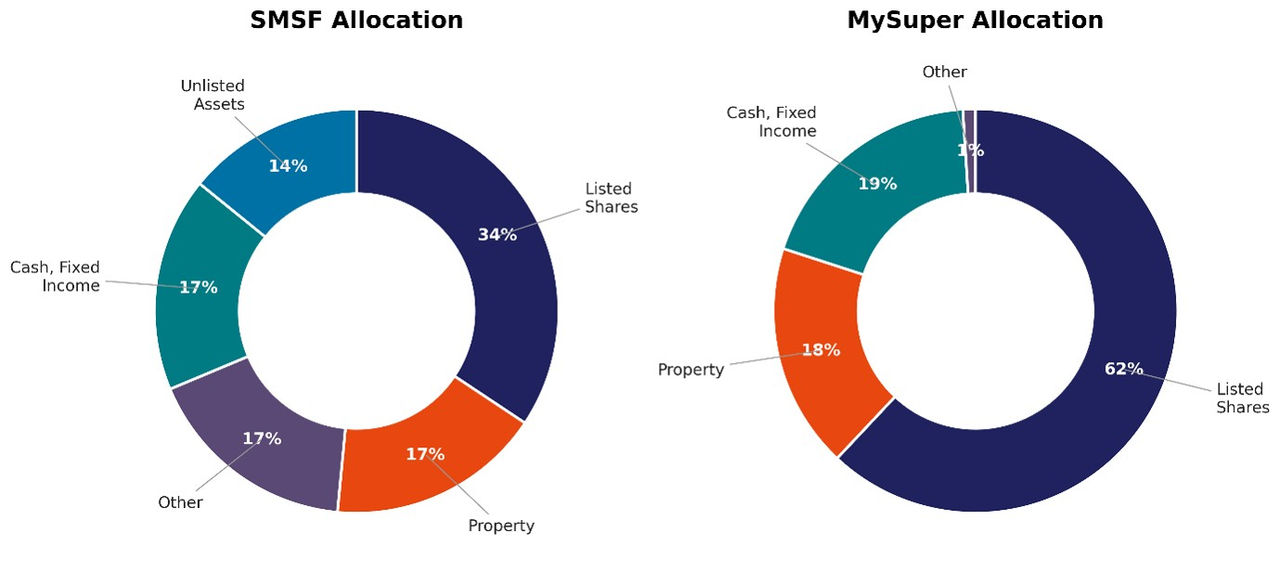
Source: Shaw and Partners Asset Management, ATO Self-Managed Super Report March 2026, APRA data, March 2026 quarter (average across all MySuper products).
ATO statistics show listed shares remain the largest asset class within SMSFs, accounting for around 34% of total assets. [3] Cash and fixed income are the second-largest allocation at roughly 17% of assets.
That combination tells us something important. Compared to MySuper allocations, SMSFs have a much smaller balance in listed shares. Historically, this would have meant less growth in assets compared to typical retail and industry super funds.
Different asset allocations can result in different long-term outcomes depending on investment objectives, risk tolerance and market conditions.
As an asset class, shares have certain attractions
The dominance of listed shares should not surprise anyone who spends time with SMSF investors. In Shaw and Partners’ opinion, Australian equities offer a combination that is difficult to replicate elsewhere. These include:
- fully franked dividends
- transparency
- liquidity
- familiarity
- access to some of the world's strongest dividend-paying companies.
Beyond the ATO data, observations from Shaw and Partners' client portfolios provide an additional lens into how active investors are positioning their retirement savings, offering a practical complement to the broader industry statistics.
Shaw and Partners’ CHESS data suggests that for many investors, superannuation is less a place for a different investment strategy and more a different structure in which they own blue chip Australian equities. Banks remain the cornerstone in both super and non-super accounts among our clients.
Shaw and Partners top 5 CHESS holdings
Non-Super holdings | Super holdings |
Commonwealth Bank | Commonwealth Bank |
BHP Group | BHP Group |
Westpac | Westpac |
| National Australia Bank | National Australia Bank |
| Wesfarmers | Wesfarmers |
Source: Shaw and Partners, as of 6 August 2026
While the overall composition of the two portfolios is strikingly similar, there are some notable differences. Gold exposure (outside the top five holdings) is more evident in Shaw and Partners’ super accounts compared to non-super accounts.
Mid-cap company exposure is more evident in non-super accounts, which suggests greater conservatism in super accounts compared to the average account.
Cash: The asset class nobody loves, yet everybody owns
One of the more surprising findings from ATO data is a 15.7% allocation to cash and term deposits within SMSFs. [4] There can be multiple uses of cash, including:
- funding pension payments
- managing portfolio volatility
- providing dry powder for opportunities
- supporting capital-preservation objectives.
Cash has historically produced different return characteristics to growth-oriented asset classes such as shares.
Consider a portfolio of 100% shares versus a portfolio with a 15.7% cash/term deposit. (Our modelling of portfolio outcomes uses return assumptions of historical equity/cash returns from 1981-2026 100% shares averaging 12.94% p.a. and 84.3% shares/15.7% cash averaging 11.76% p.a.)
On a A$100,000 starting portfolio, maintaining a permanent 15.7% cash allocation resulted in approximately A$1.04 million less wealth after 30 years, according to Shaw & Partners analysis, shown in the chart below.
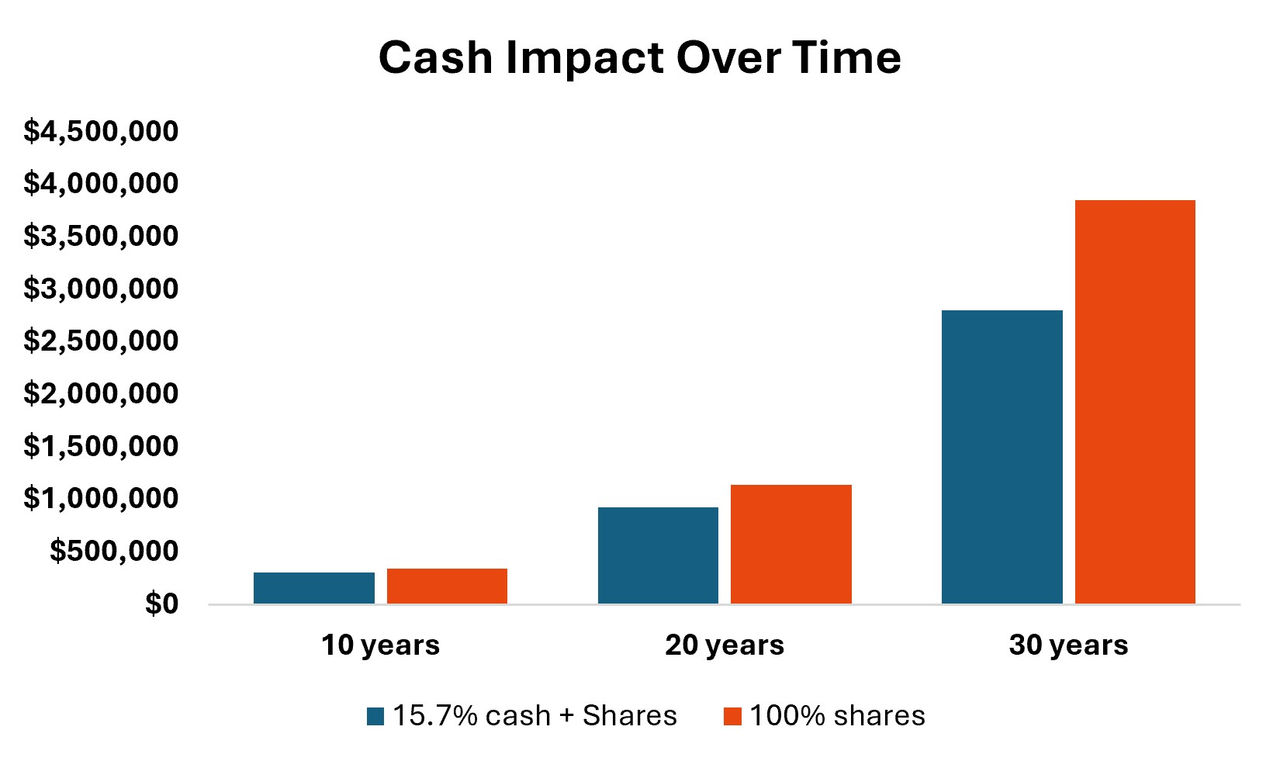
Source: Shaw and Partners, as of 6 August 2026
This is as an illustration of the maths rather than a recommendation. Actual future returns will differ from the past and analysis doesn’t consider fees, franking credits and tax.
Balancing growth and capital stability
Many investors review asset allocations over time as circumstances, objectives and investment horizons change. Some investors choose to adjust their exposure to growth and defensive assets over time.
As the compounding analysis, shown in the chart above demonstrates, even a relatively small and permanent increase in allocations to cash and fixed income can have a substantial long-term impact on wealth creation for SMSFs over long periods, so should be considered carefully.
Over a multi-decade investment horizon, the difference can amount to well over a million dollars in foregone wealth, largely because the opportunity cost can compound quietly over time.
There is another side to the equation with risk. Holding a growth-heavy SMSF portfolio, which owns mostly shares, into retirement may introduce sequencing risk.
This risk can occur if there is a major market correction just before or after retirement that permanently damages portfolio sustainability if assets must be sold to fund income. This can potentially permanently impair portfolio value and materially reduce the ability of remaining SMSF assets to participate in a subsequent market recovery.
A checklist for SMSF investors
Growth, longevity and the retirement income transition are key considerations for SMSF investors. Here are three other things to consider:
- Don’t confuse retirement with the finish line. A 65-year-old today can reasonably expect 20-30 years of retirement or more. Longevity may be a reason to consider holding growth assets for longer.
- Cash holdings have historically produced lower returns than some growth asset classes over long periods. While it is important to hold a buffer in case you need cash, over the longer term, this can have an impact on long-term investment returns.
- Asset allocation is one factor that some investors reassess as circumstances change over time. As we grow older, asset allocations tend towards greater fixed income/cash each year to plan for drawdowns and a need to protect capital as income decreases.
Conclusion
Drawing on both ATO statistics and portfolio data observed across Shaw and Partners clients, the picture that emerges is one of investors seeking to balance income, growth and capital preservation within an increasingly complex retirement landscape, where longer life expectancies are extending investment time horizons well beyond retirement.
----------------------------------
Sources:
[1] According to the Australian Taxation Office (ATO), SMSFs now manage more than A$1 trillion in assets across more than 650,000 funds and over 1.2 million members. ATO Self-Managed Super Report March 2026
[2] Ibid
[3] ATO Self-Managed Super Report March 2026
[4] Ibid
About the author
DISCLAIMER
This article has been prepared by Shaw and Partners Limited (ABN 24 003 221 583, AFSL No. 236048) based on the facts known to it at the time of preparation and does not purport to contain all relevant information in respect of the financial products to which it relates. Any projections are estimates only and may not be realised in the future, past performance is not a reliable indicator of future performance. This article contains general information only and does not take into account any person’s objectives, financial situation or needs. Before acting on any information, investors should consider its appropriateness having regard to their own circumstances and seek personal financial advice where appropriate.
More Investor Update articles
Don’t miss the latest insights from ASX Investor Update on LinkedIn
The views, opinions or recommendations of the author in this article are solely those of the author and do not in any way reflect the views, opinions, recommendations, of ASX Limited ABN 98 008 624 691 and its related bodies corporate (“ASX”). ASX makes no representation or warranty with respect to the accuracy, completeness or currency of the content. The content is for educational purposes only and does not constitute financial advice. Independent advice should be obtained from an Australian financial services licensee before making investment decisions. To the extent permitted by law, ASX excludes all liability for any loss or damage arising in any way due to or in connection with the publication of this article, including by way of negligence.