
Recent S&P/ASX 200 weakness attracting a variety of bullish option trades
- Tue 28 April 2026
- 5 MIN READ

The first three weeks of March were a difficult period for equity markets around the world and the S&P/ASX 200 was among the casualties, dropping by over 8% since the last trading day of February. As of 20 March, the index matches the levels from last November. The dip to the mid 8,000s in November followed a move to over 9,000. It may be that some traders expect stocks to recover in a similar fashion. To illustrate this recent price action, the chart below shows daily prices from 1 October 2025 through 20 March 2026.
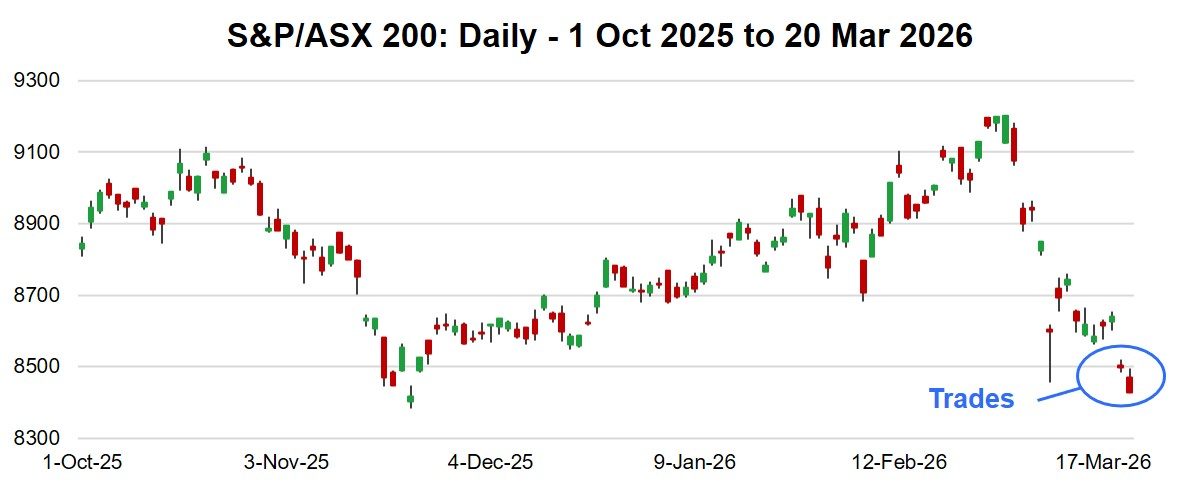
Data sources: Bloomberg and author calculations
The last two days on the price chart are highlighted, as the trades discussed in this analysis occurred on those two trading days. Note to the left of the highlighted price action is the previous bottom in November. The following trades are well positioned if the S&P/ASX 200 repeats the November rebound.
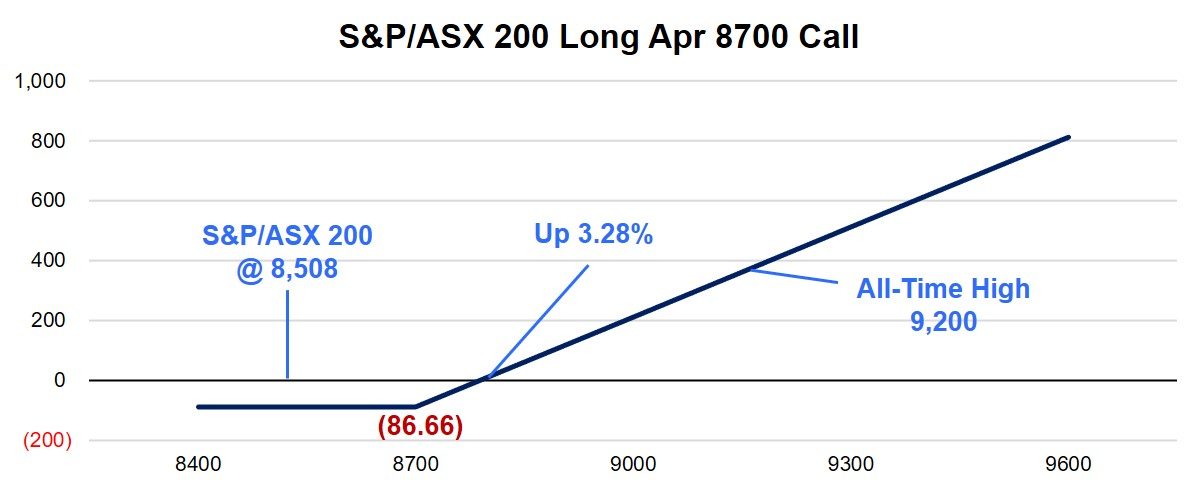
The first trade is a very basic structure but demonstrates that even large institutional traders will take a long position in a single contract. The specific trade is a buy of 300 S&P/ASX 200 8700 Calls for 86.66. This trade was executed in three legs of 100 each at 85.00, 86.00 and 89.00, resulting in an average cost of 86.66 with the index at 8,508. The payout at April expiration appears below.
Data sources: Bloomberg and author calculations
One of the biggest dangers behind trying to buy a market that is experiencing a strong downtrend (down 8% in three weeks fits this definition), is that the momentum may continue after you purchase the underlying market. A great benefit of buying a call option is that the maximum loss is known to the trader when the trade is executed. In this case, if the S&P/ASX 200 is below 8,700 at expiration, this trade is out the 86.66 cost.
The break-even level for this trade has the index up by 3.28% between execution and April expiration, less than half the drop experienced over the past three weeks. Finally, we included the all-time high of 9,200 since it is a significant level and may be a price target for this trade. A rebound to that level would result in a profit of 413.34 per contract.
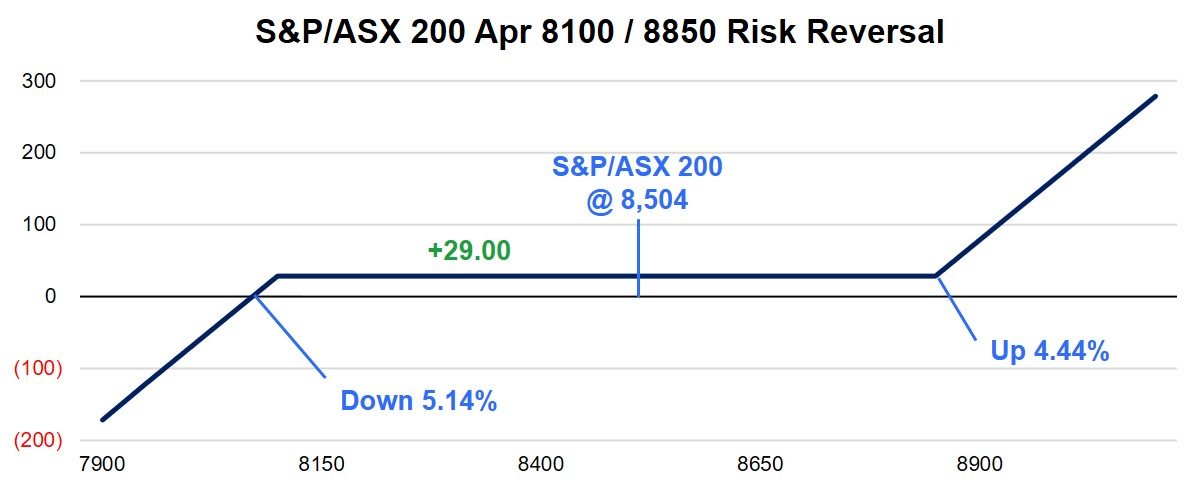
A few minutes later, on the same day (19 March 2026), a trader executed a structure that is surprisingly not used more with S&P/ASX 200 index options. With the index at 8,504, a trader sold 161 of the S&P/ASX 200 Apr 8100 Puts for 72.00 and applied those proceeds to purchase 161 S&P/ASX 200 Apr 8850 Calls for 43.00, resulting in a credit of 29.00 and a payoff shown below.
Data sources: Bloomberg and author calculations
This trades profit is 29.00 as long as the S&P/ASX 200 is between 8,100 and 8,850 at expiration. A drop of 5.14% from where the index was quoted would result in losses, while a rise of 4.44% or more for this spread would result in profits above the initial credit. Recall, the index has already given up over 8%, so to hit the downside break-even it would be over 13% off recent highs. A factor this trader likely considered for this trade structure.
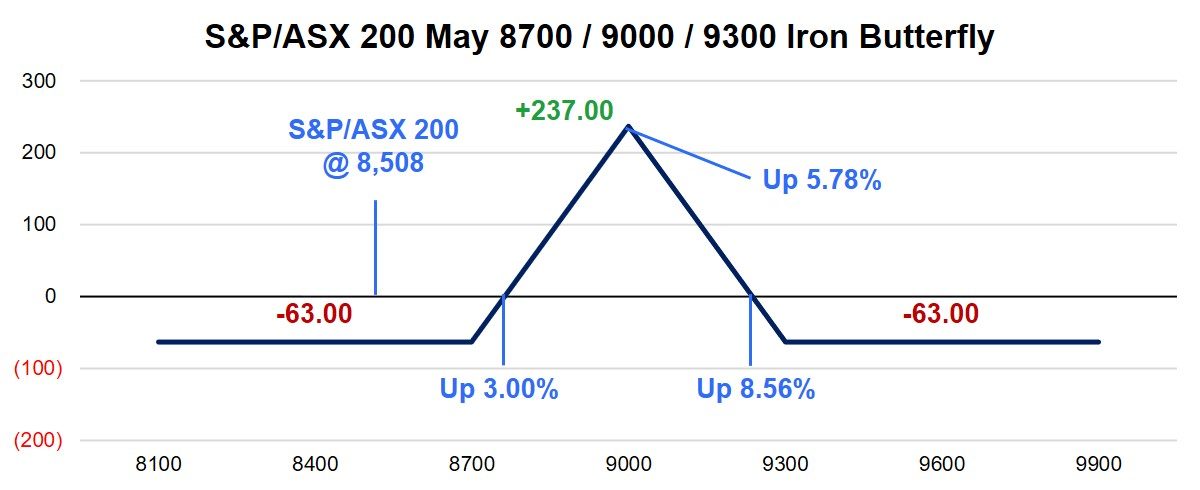
A bullish trade from 19 March 2026 worth noting uses the iron butterfly set up, which is normally considered a neutral trade. However, there are instances where the iron butterfly makes sense if a trader believes a market is going to move to a specific price point. In this case it is 9,000.
With the S&P/ASX at 8,508, a trader sold 180 S&P/ASX 200 May 9000 Puts for 519.00 and sold the same number of May 9000 Calls for 70.00. The spread was completed by purchasing the S&P/ASX May 8700 Puts for 333.00 and buying the May 9300 Calls for 19.00. The net result is a credit of 237.00 and a payoff at expiration that appears below.
Data sources: Bloomberg and author calculations
This structure benefits from the index rising 5.78% and settling right at 9,000 on May expiration. The trade realises a partial profit is the index is higher by between 3.00% and 8.56% at expiration. Of course, the trade may be exited if the index approaches 9,000 before expiration, but the profit will be less than the 237.00 credit. Finally, the all-time high 9,200 level is not highlighted on the payoff diagram, but that level does fall within the range of profitability at expiration.
A final trade with a very long outlook was executed on 20 March 2026 with the S&P/ASX 200 at 8,468. This trade uses options expiring in March 2027, selling 214 S&P/ASX 200 Mar 2027 7800 Puts for 316.00 and purchasing the Mar 2027 puts for 138.00, taking in a credit of 178.00 per bull put spread. The payoff, if held to expiration on 18 March 2027, appears below.
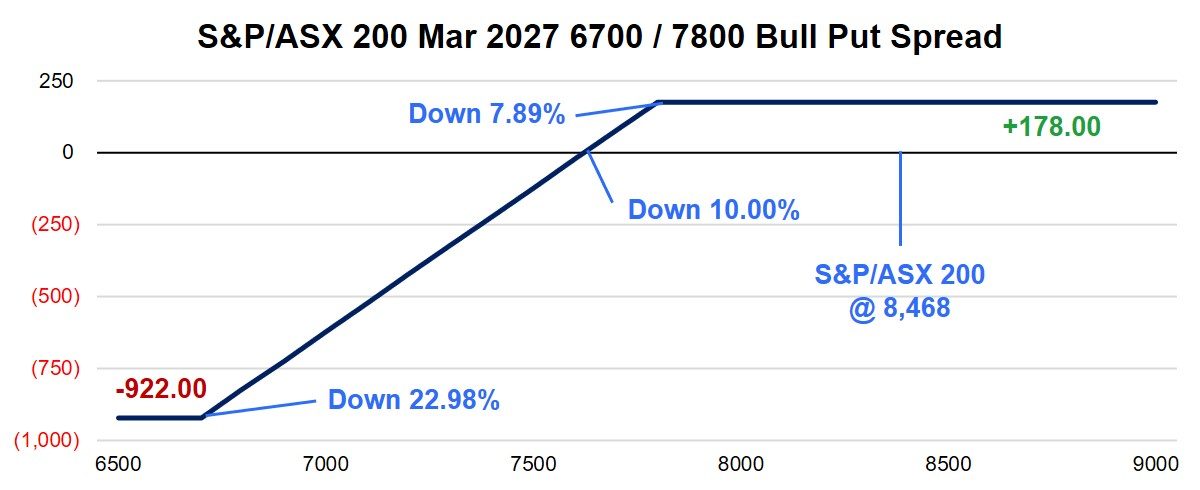
Data sources: Bloomberg and author calculations
The maximum profit for this trade is 178.00, which would be realised if the S&P/ASX 200 is over the short 7,800 strike price at expiration. This would involve a move of just under 8% to the downside. Break-even for this trade occurs if the index is at 7,628, or 10% lower. Finally, the worst-case scenario occurs if the index loses another 23% to 6,700 or lower.
The option market offers flexibility in outcomes that may not be possible in other markets. With the S&P/ASX 200 experiencing a strong downtrend, there are traders turning to options to speculate on the stock market rebounding. Those trades have differing opinions of the magnitude and time frame of the index’s recovery, but they all are used to implement a bullish outlook.
Other insights
To receive regular insights via email, please subscribe to the ASX Equity Derivatives monthly newsletter.
Insights
Equity options trading observations and insights
ASX have partnered with Dr Russell Rhoads to create a series of articles which provide observations and insights for options trading.
About the author
Disclaimer
The views, opinions or recommendations of the author in this article are solely those of the author and do not in any way reflect the views, opinions, recommendations, of ASX Limited ABN 98 008 624 691 and its related bodies corporate (“ASX”). ASX makes no representation or warranty with respect to the accuracy, completeness or currency of the content. The content is for educational purposes only. Examples used are intended to detail the performance of historic trading strategies. Past performance is not a reliable indicator of future performance. The content does not constitute financial advice. Independent advice should be obtained from an Australian financial services licensee before making investment decisions. To the extent permitted by law, ASX excludes all liability for any loss or damage arising in any way including by way of negligence. © Copyright ASX Operations Pty Limited ABN 42 004 523 782. All rights reserved 2026.