
S&P/ASX 200 Traders take advantage of support and resistance levels plus an update on a large covered call
- Thu 03 August 2023
- 2 MIN READ

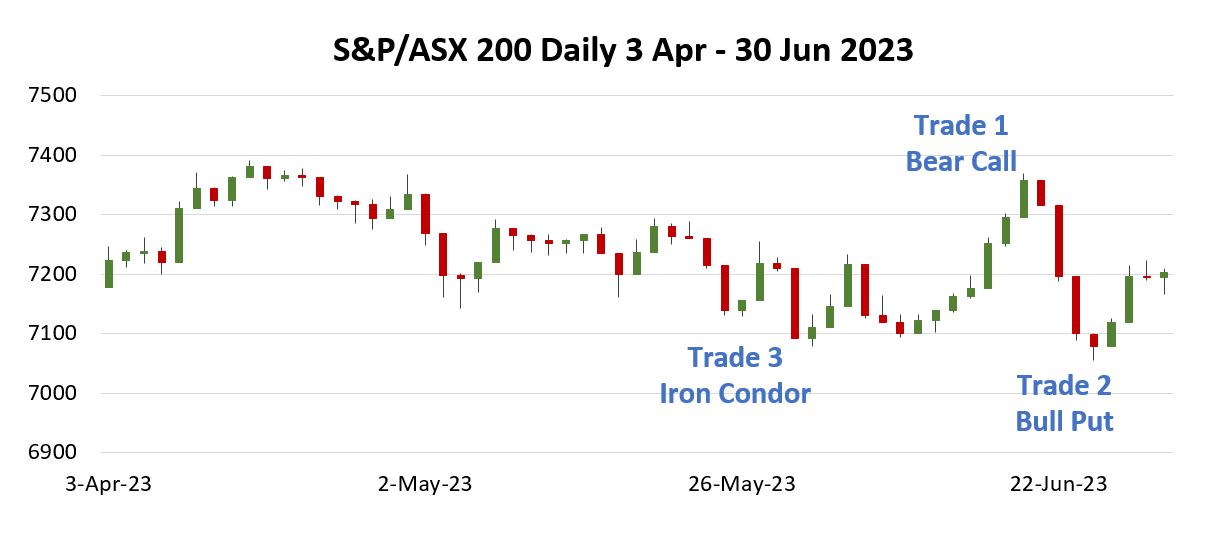
Over the course of the second quarter 2023 the S&P/ASX 200 was range bound between 7100 and 7400. Although traders gravitate toward markets that are trending, one of the great things about options is the ability to profit from a neutral market environment.
The chart below is the daily price action for the S&P/ASX 200, with the dates when trades of interest were executed.
Data Source: Bloomberg
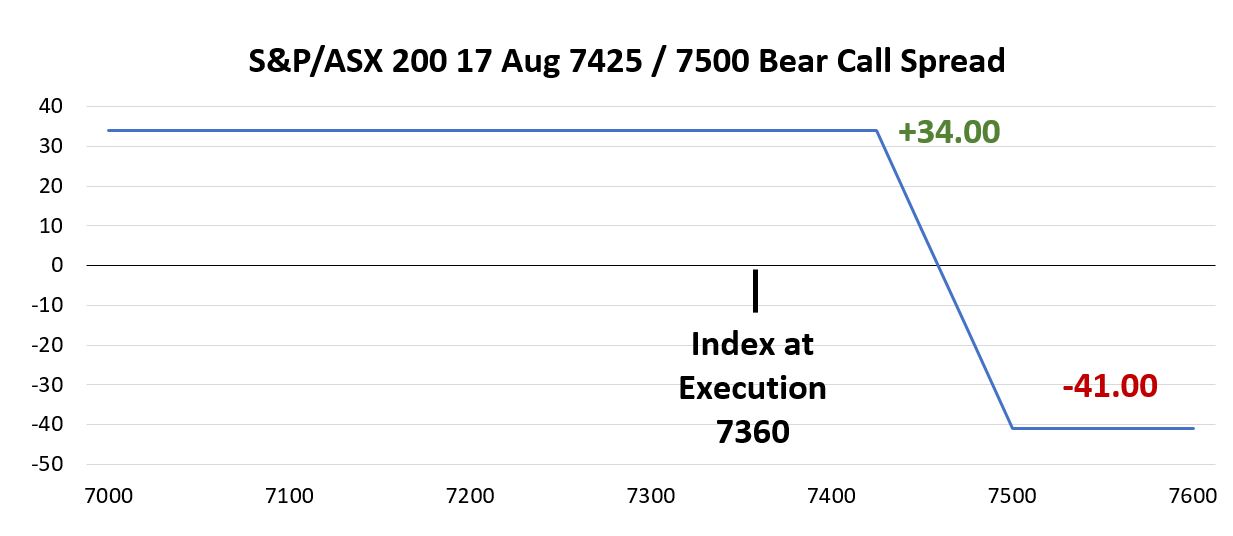
Trade 1 is a bear call spread using 17 August options. This trade was on the seventh up day in a row and near the 7400 level that the index struggled surpassing in early April. With the S&P/ASX 200 at 7360 a trader sold the 17 Aug 7425 Call at 109.00 and purchased the 7500 Call for 75.00 taking in a credit of 34.00 points. The payoff, if held to 17 August expiration, appears below.
Data Source: Bloomberg
The risk for this trade is if the index is over 7500 at expiration which would result in a loss of 41.00 points. However, the index has not topped 7425 since February, which likely is a reason this trader chose this price level for the short strike in this bearish spread.
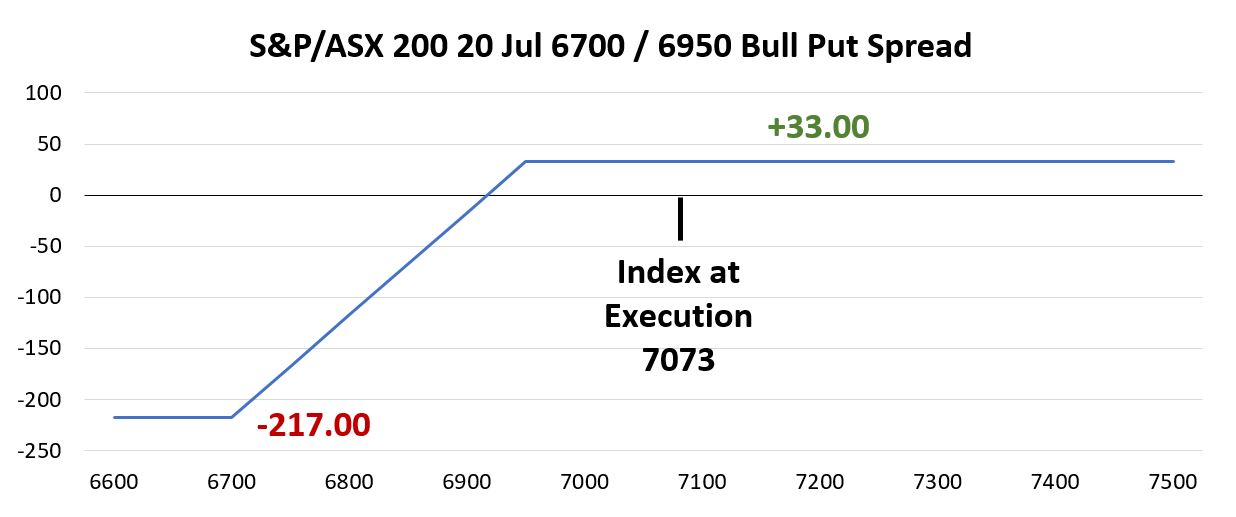
Four trading days later, the S&P/ASX 200 was just below 7100, which brought out some bullish traders for Trade 2. On 26 June, with the index at 7073, a trader sold the 20 Jul 6950 Put for 52.00 and purchased the 20 Jul 6700 Put for 19.00 taking in a credit of 33.00 points and a payoff at expiration that appears below.
Data Source: Bloomberg
The dollar risk / reward for this trade is not for the faint of heart with a potential loss of 217.00. However, this bullish trade was both well timed and right on the money with the short strike price of 6950. The index has traded a bit under 7000 since this trade was executed but has not approached the short 6950 strike price. Held through expiration, this trade realized a profit of 33.00 points.
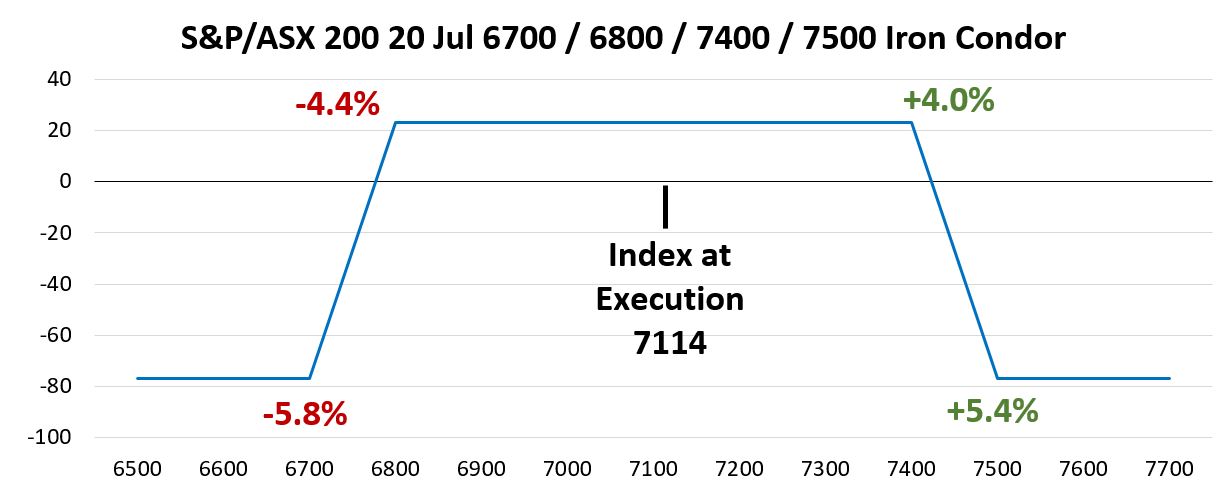
A third and final trade was executed on 1 June, a day after the index was down over 1.6%. With the index at 7114, a trader traded both sides of support and resistance by putting on an iron condor. The specific trade sold the 20 Jul 6800 Put and 7400 Call and purchased the 6700 Put and 7500 Call for a net credit of 23.00 and a payoff at expiration that appears below.
Data Source: Bloomberg
This trade has a wide berth for maximum profitability, between down 4.0% and up 4.4%. The S&P/ASX 200 did not breach either short strike between 1 June trade execution date and option expiration on 20 July, which means the gain of 23.00 points was never at risk and the maximum loss of 77.00 also did not come into play.
SDF Covered Call Trade Update
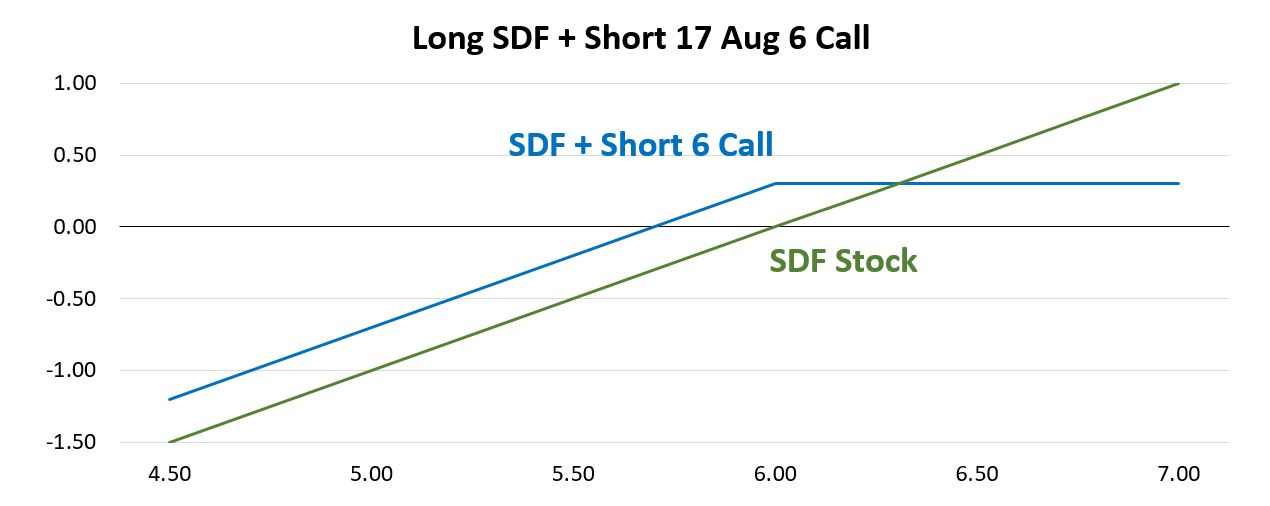
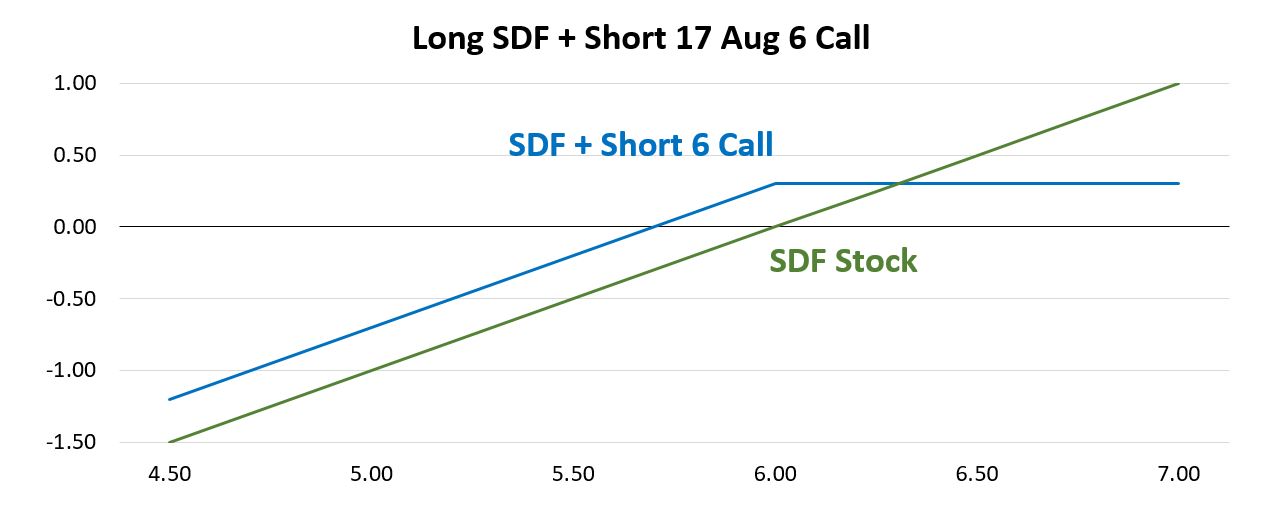
A few months ago, a large option trade in Steadfast Group (SDF) was discussed in this space. The specific trade was a covered call, selling 55,000 SDF 17 Aug 6 Calls at 0.30 to create a covered call position on 5,500,000 shares. Open interest for the SDF 17 Aug 6 Calls remains over 55,000 so it is a good assumption that this trade is still in place. The payoff at 17 August expiration appears below.
Data Source: Bloomberg
The stock was up over 9% year to date when the trade was initiated, and the 0.30 premium adds 5% to performance if the stock is under 6.00 at expiration. Above 6.00, the holder of the call option would exercise their right to buy at 6.00 and the seller of this call will need to deliver shares. The price level for SDF where the trade is leaving money on the table is 6.30, at that point any price rise for SDF is offset by the short call option adjusting for the 0.30 premium taken in when the option was sold.
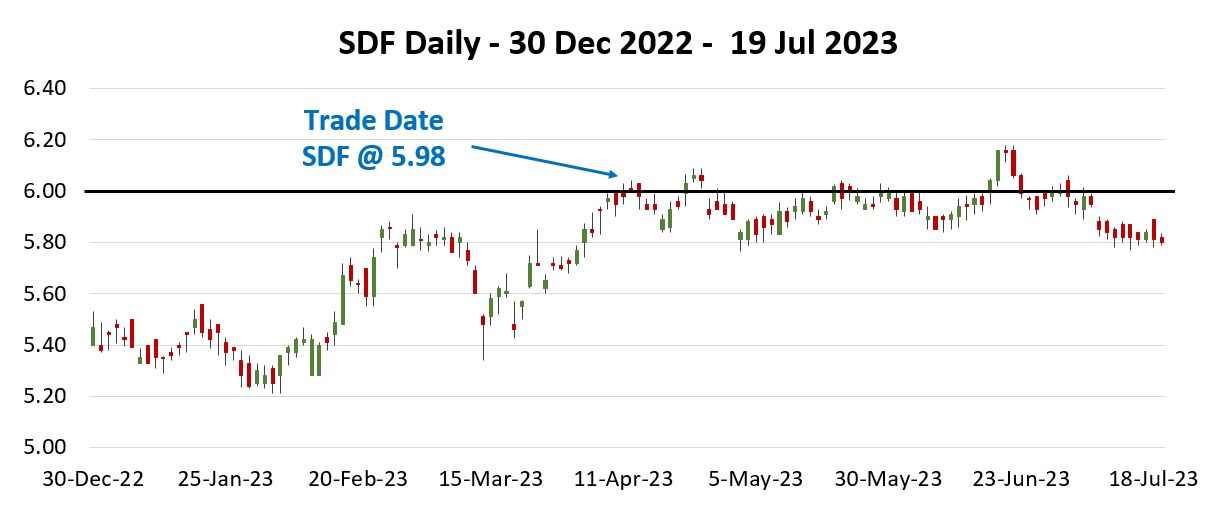
As part of checking in on this trade I looked at the price action since the trade was initiated. The chart below shows SDF daily price action for 2023 through July 19, highlighting where the trade was executed along with the strike price level (6.00). The trade occurred on 11 April with the stock just under 6.00. Since that time the stock has moved as high at 6.18, which is in a range where the shares would be called away at an effective price of 6.30.
Data Source: Bloomberg
As of 19 July, the call could be repurchased for 0.05, so the short call has an unrealized profit of 0.25. With just a few weeks to go before the short call option expires, we will be watching the trading activity around the SDF 17 Aug 6 Call and will report back on the outcome for this significant covered call.
Data Source: Bloomberg
The stock was up over 9% year to date when the trade was initiated, and the 0.30 premium adds 5% to performance if the stock is under 6.00 at expiration. Above 6.00, the holder of the call option would exercise their right to buy at 6.00 and the seller of this call will need to deliver shares. The price level for SDF where the trade is leaving money on the table is 6.30, at that point any price rise for SDF is offset by the short call option adjusting for the 0.30 premium taken in when the option was sold.
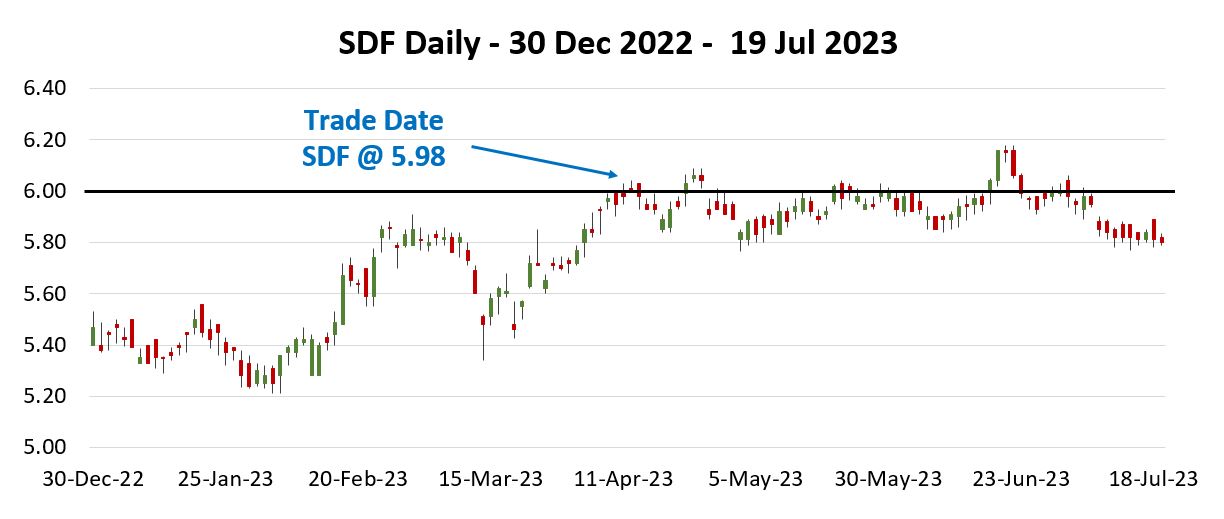
As part of checking in on this trade I looked at the price action since the trade was initiated. The chart below shows SDF daily price action for 2023 through July 19, highlighting where the trade was executed along with the strike price level (6.00). The trade occurred on 11 April with the stock just under 6.00. Since that time the stock has moved as high at 6.18, which is in a range where the shares would be called away at an effective price of 6.30.
Data Source: Bloomberg
As of 19 July, the call could be repurchased for 0.05, so the short call has an unrealized profit of 0.25. With just a few weeks to go before the short call option expires, we will be watching the trading activity around the SDF 17 Aug 6 Call and will report back on the outcome for this significant covered call.
Other Insights
This article kicks-off insights observed during the second half of 2023. To receive these insights via email, please subscribe to the ASX Equity Derivatives monthly newsletter.



About the author
Disclaimer
The views, opinions or recommendations of the author in this article are solely those of the author and do not in any way reflect the views, opinions, recommendations, of ASX Limited ABN 98 008 624 691 and its related bodies corporate (“ASX”). ASX makes no representation or warranty with respect to the accuracy, completeness or currency of the content. The content is for educational purposes only and examples used detail the performance of historic trading strategies, and as such past performance is no guarantee of future performance. The content does not constitute financial advice. Independent advice should be obtained from an Australian financial services licensee before making investment decisions. To the extent permitted by law, ASX excludes all liability for any loss or damage arising in any way including by way of negligence.