• publish

Module 6: Strategies for a moderate price decrease

The taken put option can be used to protect a holding of the underlying shares, or to profit from a fall in the share price. Used in the second way, the taken put offers increasing profits as the share price falls, while limiting losses to the premium paid. But what if you think the stock's price will fall only moderately. Is there a better strategy?
Topic 1: Strategy overview

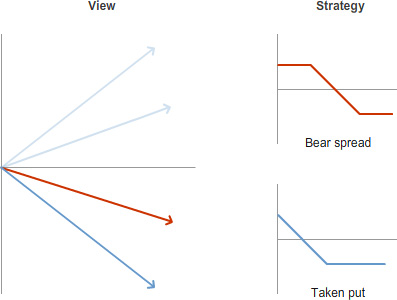
The taken put option can be used to protect a holding of the underlying shares, or to profit from a fall in the share price.

Used in the second way, the taken put offers increasing profits as the share price falls, while limiting losses to the premium paid.

But what if you think the stock's price will fall only moderately. Is there a better strategy?
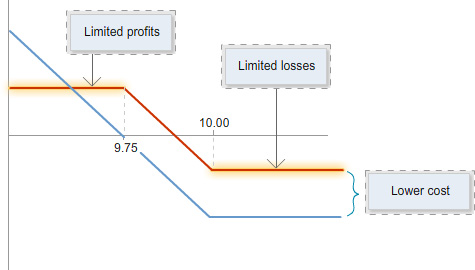
Diagram with headings “View” and “Strategy”. Under “View”, four arrows extend from a central point, with two darker arrows indicating downward directions. Under “Strategy”, two payoff diagrams are labelled “Bear spread” and “Taken put”, each showing a line that declines and then levels off at different positions on the chart.

Construction

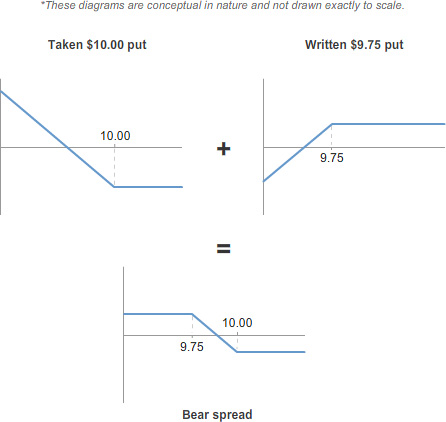
Diagram showing a taken $10.00 put and a written $9.75 put connected by a plus symbol, resulting in a bear spread shown below. Three payoff diagrams illustrate the two individual put positions and the resulting bear spread, with strike prices marked at 9.75 and 10.00. A note states that the diagrams are conceptual in nature and not drawn exactly to scale.

The bear spread offers a way of gaining exposure to a moderate fall in the share price but for a lower cost than the taken put.

The bear put spread involves the purchase of one put and the sale of another put with a lower strike price and the same expiry.

The spread is typically entered with the share price around the strike of the bought option.


Example

With XYZ shares at $10.00, you enter the following strategy:

  • Take one XYZ 1000 put @ $0.26
  • Write one XYZ 975 put @ $0.15

Limited profits, low cost

The sale of the lower strike put means your potential profits are limited.

However, the premium you receive for writing the put offsets the cost of the taken put. The net cost of the spread in our example is $0.11. This the most you can lose.

In return for accepting a cap on your potential gains, you can profit from a fall in the share price for a lower cost than an outright taken put.

Line chart comparing two payoff lines with strike prices marked at 9.75 and 10.00. Callout labels identify “Limited profits”, “Limited losses”, and “Lower cost”, with the highlighted line positioned between the upper and lower payoff lines.

Volatility

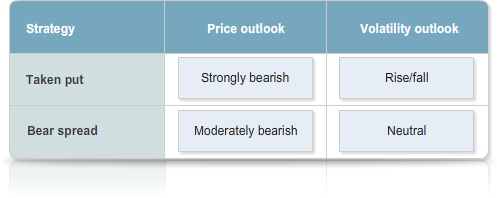
Table with columns labelled “Strategy”, “Price outlook”, and “Volatility outlook”. The rows show “Taken put” with “Strongly bearish” and “Rise/fall”, and “Bear spread” with “Moderately bearish” and “Neutral”.

The bear spread reflects a view that volatility will stay steady or increase slightly.

The taken put will benefit from an increase in the volatility of the underlying stock, while the written put will be hurt.

A significant rise/fall in volatility therefore does not affect the bear spread in the same way that it benefits or hurts the outright taken put.

Time decay

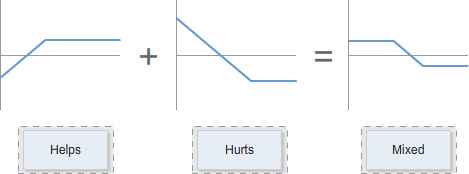
Time decay has a mixed effect on the bear spread. It hurts the taken put, and helps the written put.

Because time decay benefits one leg and hurts the other, its overall effect on the bear spread is less severe than on the taken put.

Three payoff diagrams connected by plus and equals symbols. The first diagram is labelled “Helps”, the second is labelled “Hurts”, and the resulting diagram is labelled “Mixed”, with each diagram showing a different line shape plotted on horizontal and vertical axes.

Bull spread, bear spread

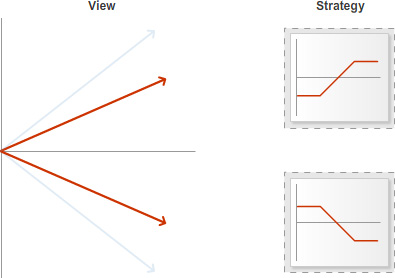
Diagram with headings “View” and “Strategy”. Under “View”, two highlighted arrows extend upward and downward from a central point. Under “Strategy”, two payoff diagrams are shown, one with a line that rises and then levels off, and another with a line that falls and then levels off.

The bear spread in a falling market is the equivalent strategy to the bull spread in a rising market.

Both strategies reflect a view that the share price will move moderately in the relevant direction. Both offer limited profits and limited losses.

The bull spread was covered in Module 5.

Topic 2: Profits, losses and breakeven

The straddle: maximum profit, maximum loss, breakeven

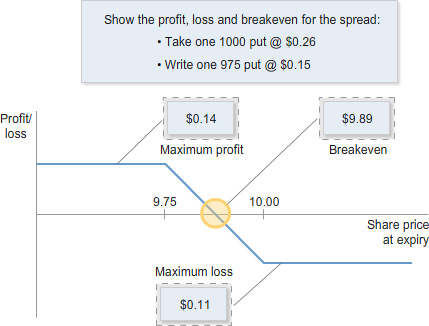
The most you can lose is the net cost of the bear spread: the premium you pay for the taken put, less the premium you receive for the written put.

Your maximum profit is the difference between the strike prices of the two options, less the cost of the strategy.

The breakeven point is the upper strike price less the net cost of the strategy.

Line chart showing profit or loss against share price at expiry, with strike prices marked at 9.75 and 10.00. Annotations identify maximum profit of $0.14, maximum loss of $0.11, and a breakeven point of $9.89. A note above the chart lists “Take one 1000 put @ $0.26” and “Write one 975 put @ $0.15”.

Calculating your profit/loss at expiry

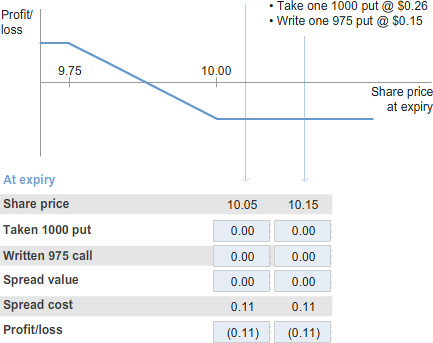
Your profit or loss at expiry will be the value of the spread less the cost of the strategy.

The value of the spread at expiry is simply the value of the taken put less the value of the written put.

Line chart showing profit or loss against share price at expiry, with strike prices marked at 9.75 and 10.00. A table below lists share prices of 10.05 and 10.15, with rows for taken 1000 put, written 975 call, spread value, spread cost, and profit or loss. Notes above the chart state “Take one 1000 put @ $0.26” and “Write one 975 put @ $0.15”.

Scenario 1: Share price above upper strike

If the share price at expiry is above the strike price of the taken put, the spread will have a value of zero, as both options will expire worthless.

You make the maximum possible loss, the net cost of the strategy.

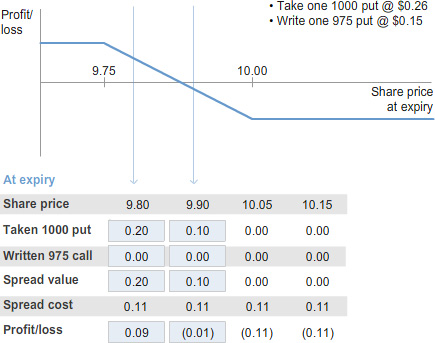
Scenario 2: Share price between strikes

If the share price at expiry is between the strikes of the two puts, you may make either a profit or a loss, depending on how far the share price has fallen.

The written put is out of the money and will expire worthless, while the taken put is in the money and will be worth intrinsic value. The value of the spread is therefore the same as the value of the put.

Your profit/loss will be the value of the put less the cost of the spread.

Line chart showing profit or loss against share price at expiry, with strike prices marked at 9.75 and 10.00. A table below lists share prices of 9.80, 9.90, 10.05, and 10.15, with rows for taken 1000 put, written 975 call, spread value, spread cost, and profit or loss. Notes above the chart state “Take one 1000 put @ $0.26” and “Write one 975 put @ $0.15”.
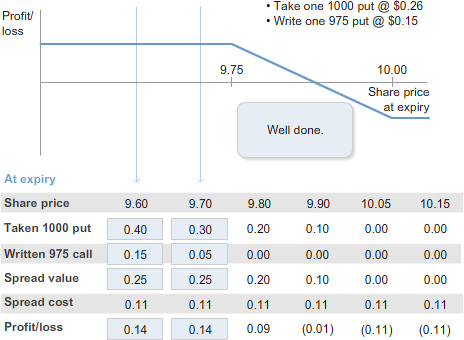
Line chart showing profit or loss against share price at expiry, with a flat section followed by a downward-sloping line between strike prices marked at 9.75 and 10.00. A table below lists share prices of 9.60, 9.70, 9.80, 9.90, 10.05, and 10.15, with rows for taken 1000 put, written 975 call, spread value, spread cost, and profit or loss. A callout box in the chart area contains the text “Well done.”

Scenario 3: Share price below lower strike

If the share price at expiry is below the strike of the written put, you will make the maximum profit. This is the difference between the strikes less the cost of the spread.

Your profit remains the same no matter how far below the strike price of the written option the share price has fallen. For every cent the share price has fallen, the increase in value of your taken put is offset by the increase in value of the written put.

Before expiry

You can close out your position on market at any time - you don't have to wait until expiry.

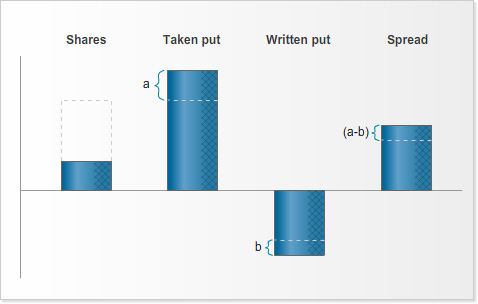
If the share price falls as expected, both put options should increase in value.

The taken put should rise in value by more than the written put, due to the difference in the deltas of the two options. The net effect is that the spread increases in value.

The delta of the taken put in our example might be around -0.45, and the delta of the written put around -0.3, giving a position delta of -0.15.

If the stock price falls by $0.10, the spread should rise in value by about $0.015.

Bar chart with categories labelled Shares, Taken put, Written put, and Spread. The taken put bar is labelled “a”, the written put bar is labelled “b”, and the spread bar is labelled “(a-b)”, showing the relationship between the individual positions and the resulting spread value.

Topic 3: Benefits, risks and other features

Put spread vs taken put

Line chart showing profit or loss against share price at expiry, with two plotted lines labelled “Take 1000 put @ $0.26” and “Write 975 put @ $0.15”. Strike prices of 10.00 and 10.25 are marked on the horizontal axis, and shaded regions highlight differences between the two payoff lines at various share price levels.

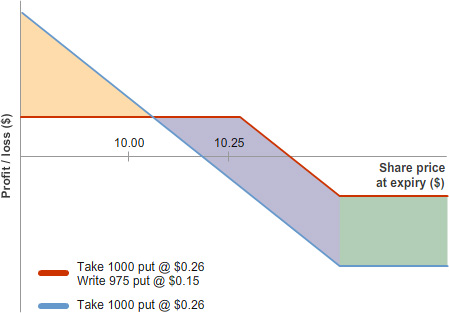
The main benefit of the put spread compared to the taken put is the lower cost.

If, against your expectations, the share price rises, you will lose less than had you bought the put.

The trade-off for this is that your profits are capped. If the share price falls significantly, you do not have the profit potential the taken put offers.

The spread produces a better result than the taken put if the share price rises, or falls moderately.

Early exercise

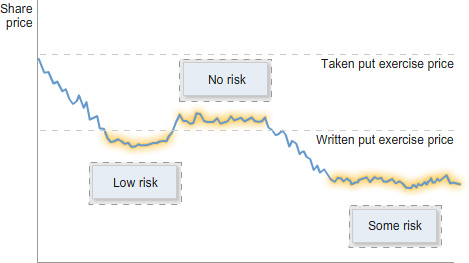
If the share price falls only moderately, there is a low risk of early exercise, as the written option will generally be out of, or around, the money.

However, if the stock price falls well below the strike price of the written put, the risk of early exercise increases.

If your written put is exercised, you will have to buy the underlying shares. However, if you do not wish to hold the shares, you can always sell them straight away by exercising your taken put.

This involves a degree of administration, which will be coordinated by your broker.

Line chart showing share price movement over time with horizontal reference lines labelled “Taken put exercise price” and “Written put exercise price”. Annotated regions are labelled “No risk”, “Low risk”, and “Some risk” at different points along the share price path.

No margins

Table with columns labelled “Risk”, “Margins payable”, and “Strategy”. The first row shows limited risk, no margins payable, and put spread. The second row shows unlimited risk, margins payable, and written put.

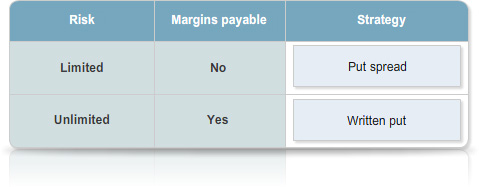
You do not have to pay margins on a bear put spread.

Although the strategy includes a written option, your risk is limited.

The most you can lose is the cost of the spread, which you pay at the time you enter the position.

Trading costs

The spread can be costly in terms of brokerage.

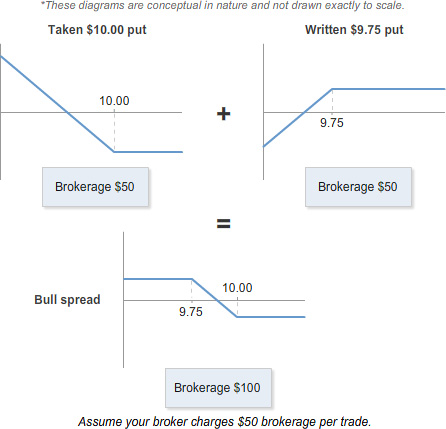
If your broker charges 'per trade', you will pay brokerage on each leg when you enter the strategy. You will also be charged brokerage on each leg you close out.

As the spread is a strategy offering limited profit potential, it is particularly important to factor brokerage into your calculations. If you are trading a small number of contracts, costs can significantly reduce your profits.

Diagram showing a taken $10.00 put and a written $9.75 put combined with a plus symbol to form a bull spread. Three payoff diagrams illustrate the two individual option positions and the resulting bull spread, with strike prices marked at 9.75 and 10.00. Brokerage costs of $50 are shown for each option position and $100 for the combined spread. Notes state that the diagrams are conceptual in nature, not drawn exactly to scale, and assume brokerage of $50 per trade.

Topic 4: Follow-up action

At expiry

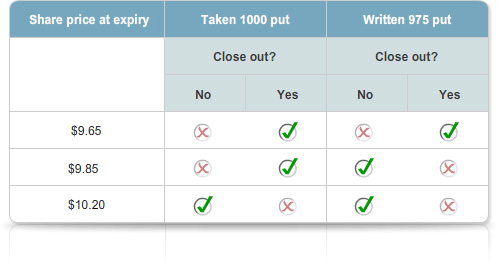
Table showing share prices at expiry of 9.65, 9.85, and 10.20, with columns for taken 1000 put and written 975 put. Each option position includes close-out choices of yes or no, with tick and cross symbols indicating outcomes for each share price level.

You will need to take action on any legs that are in the money at expiry.

If the share price is below the strike price of the written put, you will need to close out both options. If you do not close out the written put, it will be exercised and you will have to buy the underlying shares.

If the share price is between the two strikes, the written put will expire worthless. You will need to sell the taken put.

If the share price is above the strike price of the bought put, no action is required, as both options will expire worthless.

Before expiry

You can exit your position at any time prior to expiry.

Stock stays steady or rises

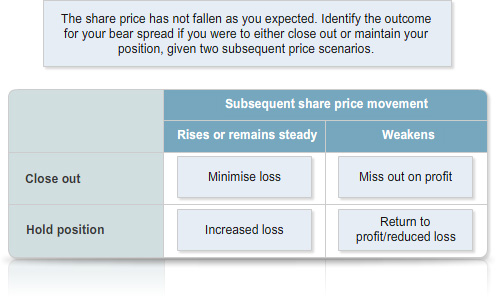
If the stock does not produce the price movement you expected, the spread will lose value as time passes. You may need to reassess your original view.

If you maintain your moderately bearish view, you can leave the strategy in place.

If your view on the stock has changed, you could consider taking the strategy off while the taken put still has some time value. The longer the stock price stays steady, the more time decay will damage your position.

Table showing outcomes for a bear spread under subsequent share price movements labelled “Rises or remains steady” and “Weakens”. Rows labelled “Close out” and “Hold position” contain outcome labels including “Minimise loss”, “Miss out on profit”, “Increased loss”, and “Return to profit/reduced loss”.
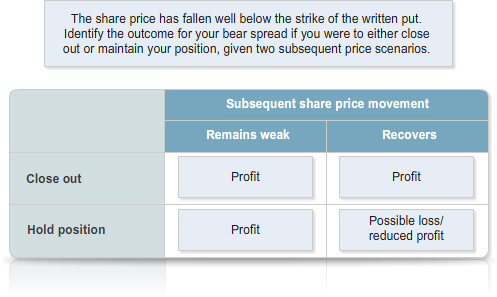
Table showing outcomes for a bear spread after the share price has fallen below the strike of the written put. Columns are labelled “Remains weak” and “Recovers” under “Subsequent share price movement”, and rows are labelled “Close out” and “Hold position”. Outcome cells contain “Profit” or “Possible loss/reduced profit”.

Stock falls

If the stock price falls well below the strike of the written put, it is generally advisable to close out your position early. There is little to be gained by holding your position any longer.

The spread should be worth close to its maximum possible value, so you may make close to the maximum possible profit without having to hold the position until expiry.

A second benefit of taking the strategy off early is that the risk of early exercise is removed.

What if the written put is exercised?

You must buy the underlying shares if your written put is exercised.

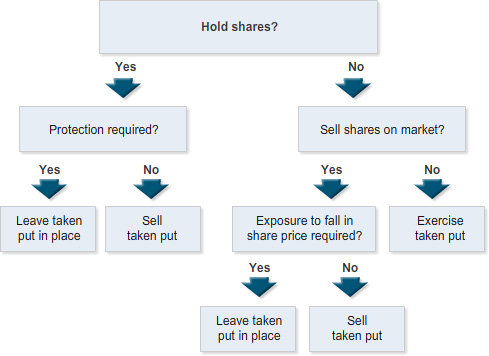
You then have to decide whether to hold or sell these shares.

If you want to sell the shares, you can:

  • exercise your taken put, or
  • sell the shares on market.

If you do not exercise your taken put, you must decide whether to:

  • close out the put on market, or
  • leave it in place.
Flowchart beginning with the question “Hold shares?” and branching through decision points including “Protection required?”, “Sell shares on market?”, and “Exposure to fall in share price required?”. The flowchart leads to outcomes labelled “Leave taken put in place”, “Sell taken put”, and “Exercise taken put”.

Topic 5: The bear call spread

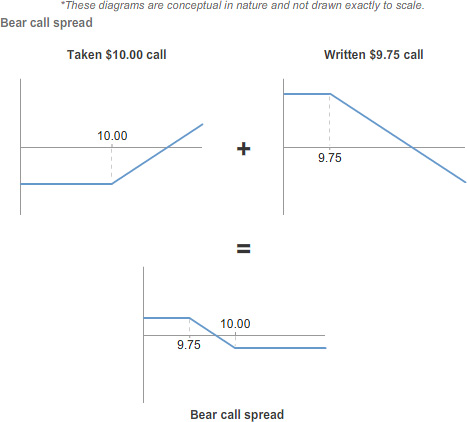
Diagram showing a taken $10.00 call and a written $9.75 call connected by a plus symbol, resulting in a bear call spread shown below. Three payoff diagrams illustrate the two individual call positions and the resulting spread, with strike prices marked at 9.75 and 10.00. A note states that the diagrams are conceptual in nature and not drawn exactly to scale.

You can also construct the bear spread with call options.

As is the case with the bear put spread, you write the lower strike option and buy the higher strike option.

The strategy reflects the same moderately bearish outlook, and offers the same limited loss, limited profit exposure.

Example

With XYZ shares at $10.00, you enter the following strategy:

  • Take one XYZ 1000 call @ $0.31
  • Write one XYZ 975 call @ $0.45

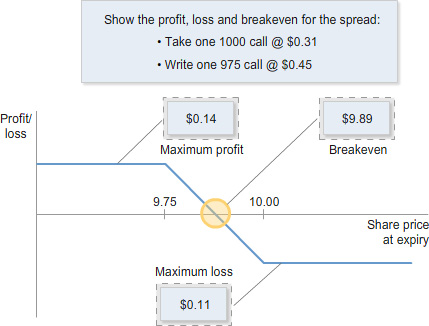
Maximum profit, maximum loss, breakeven

Your maximum profit is the amount you receive for the strategy: the premium you get for the written call, less the premium you pay for the taken call.

Your maximum loss is the difference between the strike prices of the two options, less the amount you receive for the strategy.

The breakeven point is the lower strike plus the amount you receive for the strategy.

Line chart showing profit or loss against share price at expiry, with strike prices marked at 9.75 and 10.00. Annotations identify maximum profit of $0.14, maximum loss of $0.11, and a breakeven value of $9.89. A note above the chart lists a taken 1000 call at $0.31 and a written 975 call at $0.45.

Outcomes at expiry

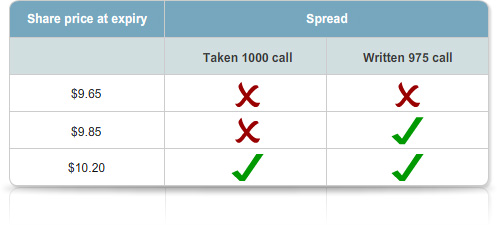
Table showing share prices at expiry of 9.65, 9.85, and 10.20, with columns labelled taken 1000 call and written 975 call. Tick and cross symbols indicate outcomes for each position at the three share price levels.

If the share price at expiry is below the strike of the written call, both options expire worthless and you make your maximum profit.

If the share price is above the strike of the taken call, both options are in the money and should be closed out. You make your maximum loss.

If the share price is between the two strikes, you must close out the written call to avoid exercise. Your taken call will expire worthless.

Why use calls?

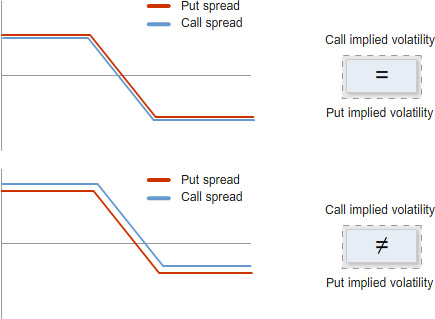
If calls and puts are trading with similar implied volatilities, the bear put spread and the bear call spread should offer similar profit and loss potential.

If, however, there is a significant difference in implied volatility between calls and puts, one method of construction may offer a pricing advantage over the other. While this is not common, it is always worth checking whether the alternative construction will give you a better result.

One advantage of the bear call spread, if at expiry the share price is below the lower strike, is that you need not close out either option. Both will expire worthless.

Another consideration is the relative liquidity of the relevant put and call series.

Two chart comparisons labelled “Put spread” and “Call spread”. In the upper comparison, the two payoff lines closely overlap and are paired with a label indicating call implied volatility equals put implied volatility. In the lower comparison, the payoff lines diverge and are paired with a label indicating call implied volatility does not equal put implied volatility.

Disadvantages of the bear call spread

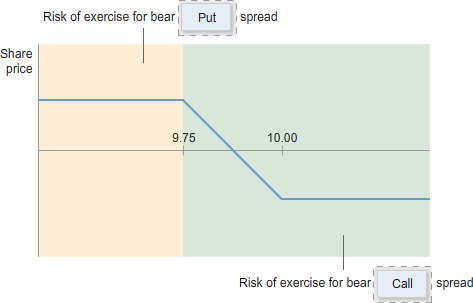
Line chart showing share price with strike prices marked at 9.75 and 10.00. The chart includes a line that declines between the two strike prices and then levels off, with shaded regions labelled “Risk of exercise for bear put spread” and “Risk of exercise for bear call spread”.

Risk of exercise

There is a higher risk of early exercise if you construct the bear spread with calls.

Assuming you enter the spread with the stock around the upper strike, the written call option is already well in the money.

Call options typically are not exercised ahead of expiry. However you need to be careful if the stock goes ex-dividend during the life of your strategy, as this is when the risk of early exercise is greatest.

If the stock has not fallen below the lower strike at expiry, you will have to take action to close out the short call, or you will be exercised.

Margins

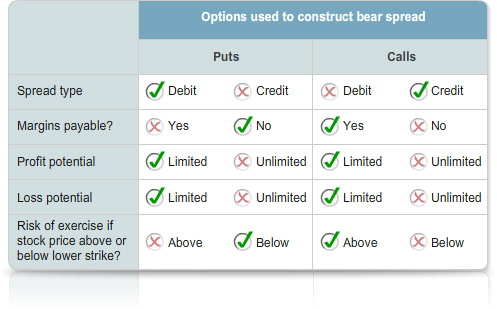
The bear call spread is called a credit spread. The call you are selling is worth more than the call you are buying, so the spread is placed for a net credit.

Because of this, the bear call spread involves the payment of margins.

The bear put spread, in contrast, is a 'debit spread', in which your maximum loss is the premium you pay at the time of entering the strategy. No margins are payable.

Table titled "Options used to construct bear spread" comparing puts and calls across categories including spread type, margins payable, profit potential, loss potential, and risk of exercise if stock price moves above or below the lower strike, with tick and cross symbols indicating applicable outcomes.

Summary

  • The bear spread reflects a moderately bearish view on the underlying shares.
  • It involves the purchase of one put option and the sale of another put with a lower strike and the same expiry.
  • The sale of the lower strike put means your potential profits are limited. In return for accepting a cap on your potential gains, you can profit from a fall in the share price for a lower cost than an outright taken put.
  • You do not have to pay margins on the bear put spread.
  • At expiry, you will need to take action on any legs that are in the money.
  • The bear spread can also be constructed using call options.
  • You take the higher strike call and write the lower strike call.
  • The bear call spread and the bear put spread usually offer similar profit and loss potential. However, you should check whether one method of construction offers a pricing advantage.
  • There is a higher risk of early exercise if you construct the bear spread with calls.
  • The bear call spread involves the payment of margins.

Practical examples of option strategies are given throughout these modules.

Prices used in the examples were calculated using an option pricing model, and are based on the following, unless otherwise specified:

  • Underlying stock price: $10.00
  • Volatility: 25%
  • Risk free interest rate: 5%
  • Days to expiry: 30
  • The stock does not go ex-dividend during the life of the option
  • American exercise style

Brokerage costs are not included in the examples. It is, however, important to take brokerage costs into account when trading options.

Please note that some payoff diagrams that appear in this course are conceptual in nature, and may not be drawn exactly to scale.

Test your knowledge